Table of Contents
What Is On Balance Volume OBV
On Balance Volume (OBV), developed by Joe Granville, is a momentum indicator that relates volume to price change. On Balance Volume indicator shows if market’s volume is flowing into or out of a security/stock. In other words, the OBV offers information regarding the strength of price movements.
- When the security/stock closes above the previous close, all of the day’s volume is considered up-volume.
- When the security/stock closes below than the previous close, all of the day’s volume is considered down-volume.
So, the OBV increases or decreases during each day in correlation on whether the price closes higher or lower compared to the close during the previous day.
How To Read On Balance Volume OBV
The main assumption is that On Balance Volume movements precede price changes. As the volume is the main fuel behind the market, OBV is designed to anticipate when major moves in the markets would occur. It is believed that “smart money” can be seen accumulating into the security/stock by a rising OBV and when the public comes along into the security/stock, both the security and the OBV will increase. The numerical value of OBV is statistically irrelevant.
The main assumptions regarding OBV are:
- a new high in the OBV indicates that buyers are stronger than sellers, and the price is likely to increase.
- a new low in the OBV indicates that sellers are stronger than buyers, and the price is likely to decrease.
- when OBV increases or decreases in tandem with the price, the underlying trend is confirmed.
- if the price precedes OBV movement, a divergence has occurred ( divergences can occur at market tops/bottoms when the price increases/decreases before the OBV.
When analyzing the on balance volume we should keep an eye on:
The trend of the on-balance-volume plotted line
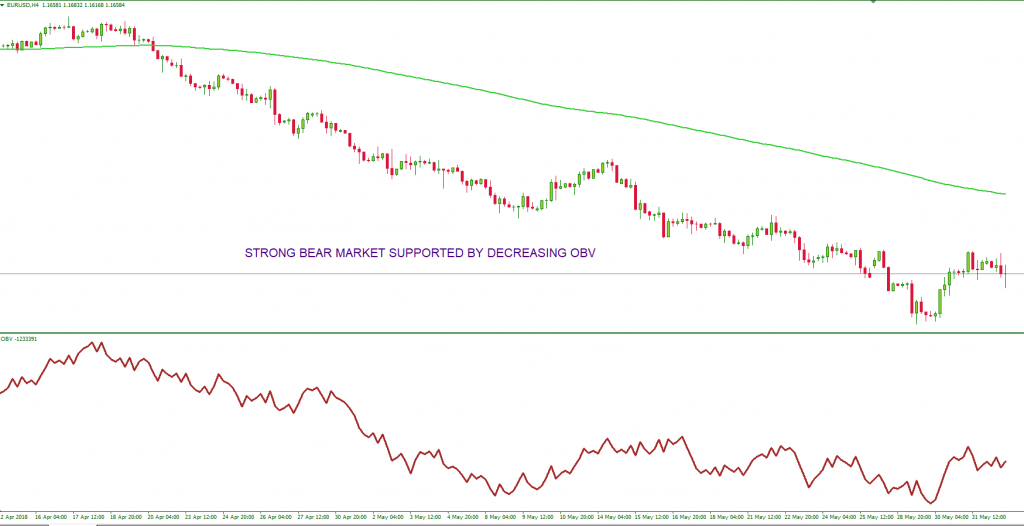
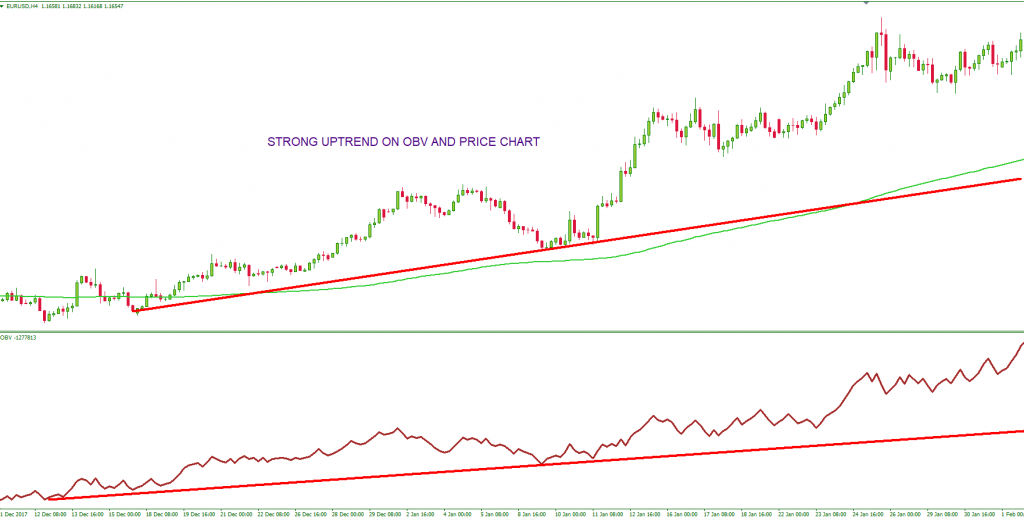
In other words, strong upward trends should have a corresponding increase in trading volume and strong downward trends should be fueled by decreasing volume. If we analyze the EUR/USD chart below, we’ll observe this relationship between OBV and price.
The relationship of the OBV line in conjunction with the market trend – in other words, we compare the trend of the OBV with the trend of the traded instrument
Potential support and resistance levels on OBV chart and on the price chart
Here is the most important rule you must follow: we always follow the direction of the On Balance Volume. We always trade in the direction of the OBV.
- An increasing OBV in conjunction with sideways action (trading range) or decreasing prices, will eventually lead to an increase in prices.
- Likewise, a decreasing OBV in conjunction with sideways action or increasing prices will eventually lead to a decrease in prices.
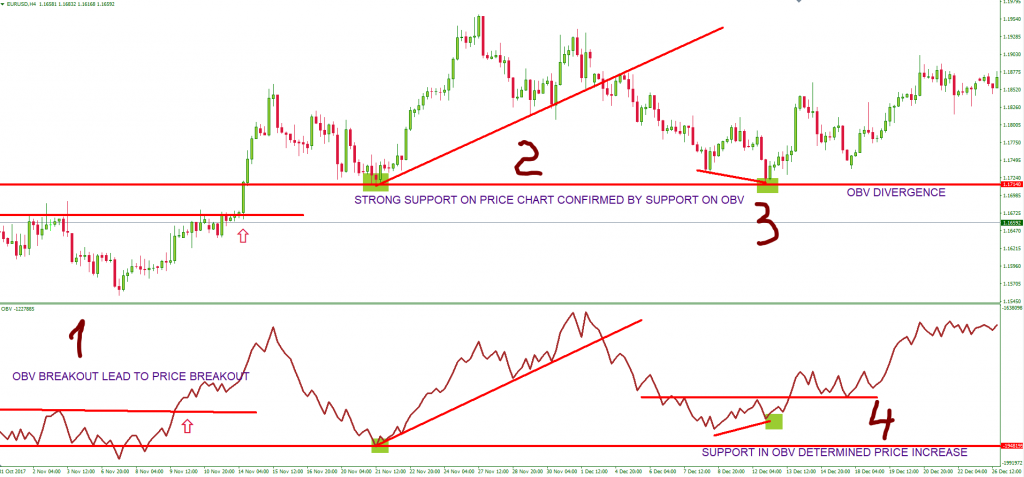
Let’s add some visuals, to understand better the leading power of the OBV.
- We observe in the EUR/USD chart that the breakout in OBV leads to a breakout in price.
- The trend line break in the OBV was confirmed by the trend line break on the chart. The support levels on OBV also acted as a support in the price chart.
- Despite the fact that the price was making lower lows, once it found support at the previous swing low, it headed back up. This price movement was lead by the divergence in the On Balance Volume.
- Another breakout in the OBV, with the previous resistance now becoming an area of support. Despite the fact that the price made a new low, it eventually followed the upward direction of the OBV.
By now, I hope you are convinced about the leading powers of the OBV. Yes, OBV is an important leading indicator, able to precede the price movements of a security/stock due to its predictive qualities. While, lagging indicators (RSI, Stochastic Oscillator, moving averages, Bollinger Bands, CCI etc.) follow price movements and don’t have reliable predictive qualities, a leading indicator like OBV is able to anticipate when major moves in the markets would occur.
How To Trade With OBV – Signals And Trading Strategies
How To Use The Volume Balance To Trade Divergences
Divergences, both bullish and bearish, can signal to traders that a price reversal could be on the cards. As we previously mentioned, we always follow the direction of the On Balance Volume indicator and we always trade in the direction of the OBV.
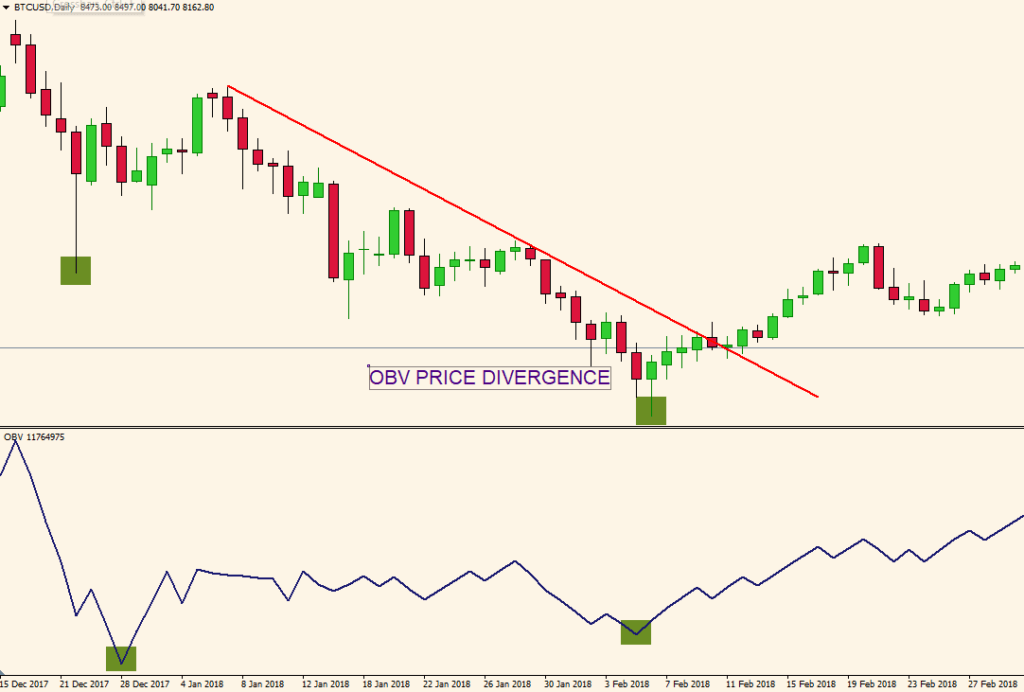
Most common way to use On Balance Volume is to scan for divergences. Divergences occur when price movement is not confirmed by the OBV, indicating a potential reversal.
Like in the case of CCI or RSI, a divergence in Price/OBV is not an exceptional signal. On the contrary, it occurs frequently and is useful only when used in conjunction with other indicators or price action.
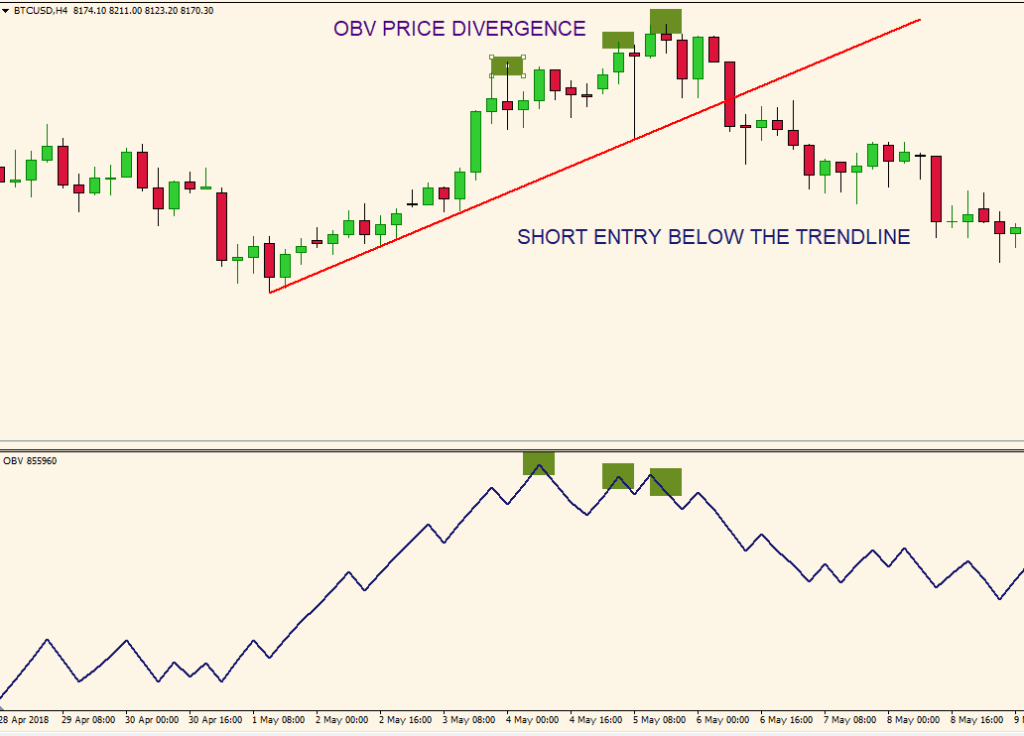
Let’s analyze the Bitcoin chart above. We can clearly see that the price is making higher highs, but the OBV is making lower highs, suggesting a possible reversal of the price. Traders cannot make a decision to enter short on the market solely on this divergence. We must use other instruments, oscillators to confirm our entry. In this example, a close of the price below the lower trend line of the upwards channel is a valid signal and short positions should be taken once the price closes below the trend line. Once the trend line was broken, the market momentum moved to the downside, confirmed by the movement of the OBV.
In this way, we filter many false signals and avoid entering the market at the wrong time.
TIP: use OBV on higher timeframes (H4 or higher)
By using higher timeframes ( D1, in the Bitcoin chart above), we’ll get more relevant signals, with safer entries and a lower chance of whipsaw.
On Balance Volume OBV – Moving Average Crossover Forex Trading Strategy
My personal preference is to add a long-term moving average on the on-balance-volume, not on the price chart, for several reasons:
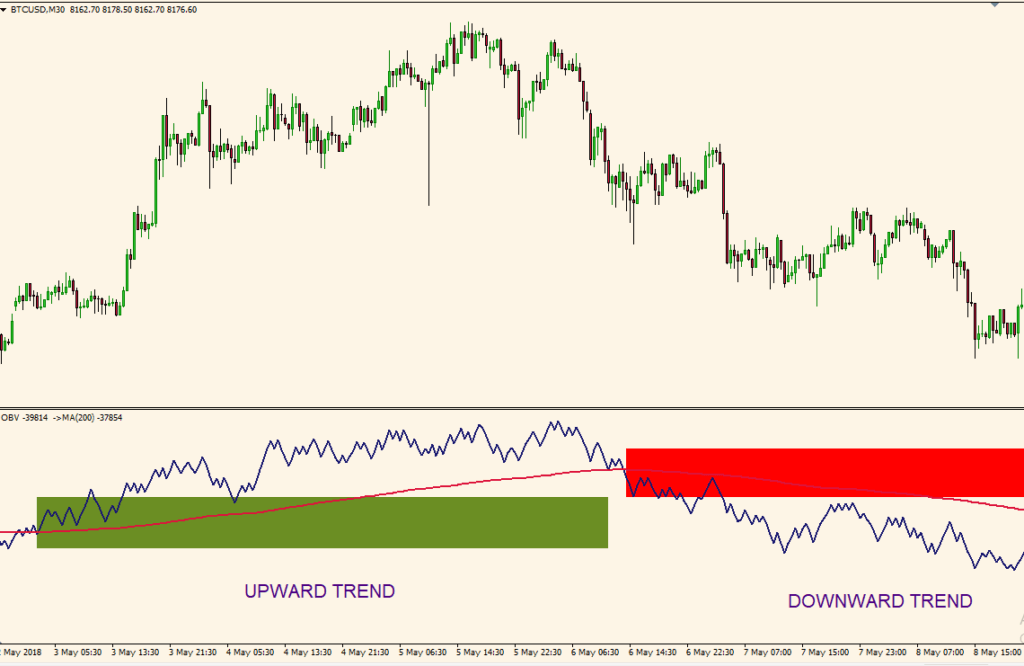
- To determine the direction of the trend – this crossover offers an excellent outlook on the prevailing trend on the market
- To trade in the direction of the main trend
When the OBV is above the moving average, it is advised to take only long positions, in the direction of the main trend. When OBV is below the moving average, only short positions should be considered.
On Balance Volume Indicator – Keltner Channel Day Trading/Swing Trading Strategy
The on-balance volume as a leading indicator works well in combination with the Keltner Channel.
Keltner Channel is a combination of an exponential moving average and the Average True Range indicator. Keltner Channel uses the Average True Range to determine the channel distance.
Keltner Channel indicator is used by traders who want to trade in the direction of the prevailing trend on the market.
The easiest way to determine the main trend is to analyze the Keltner Channel’s slope. The Keltner Channel slope is simply the direction of the channel plotted on the chart.
- If the Keltner Channel’s slope is upward, this suggests that the market currently trades in an uptrend
- If the Keltner Channel’s slope is downward, this suggests that the market currently trades in a downtrend
Now that we know the market direction, we just have to confirm it with the on-balance volume indicator.
In order to smooth the signals offered by the OBV, we’ll add a moving average to the indicator.
By adding a moving average on the OBV, we’ll trade crossover signals.
Here are the main rules that you should follow:
- We will use this setup for day trading and swing trading, so M15, M30 and H1 timeframes are suited for this system
- Plot the Keltner Channel with a 200-period exponential moving average and an ATR multiple of 2 – we use a longer period for the Keltner Channel in order to filter market noise.
- Plot the OBV indicator
- Add a 200-period exponential moving average to the OBV – a longer-term moving average added on OBV will work better than a short-term moving average. The 200 EMA will produce fewer whipsaws.
- We aim for the OBV to cross above the 200 EMA when the price is trading above the Keltner Channel for a long entry
- We aim for the OBV to cross below the 200 EMA when the price is trading below the Keltner Channel for a short entry
- Before entering a trade, we always look at the slope of the 200 EMA plotted on the OBV. This is maybe the most important confirmation. We want the slope of the 200 EMA plotted on the OBV to be in line with the slope of the Keltner Channel
- Stop loss placement is above or below the Keltner Channel.
- Aim for a risk/reward ratio of at least 2:1. We exit manually when an opposite crossover occurs or the price closes in the opposite side of the Keltner Channel
Let’s look at some charts to see this system in action.
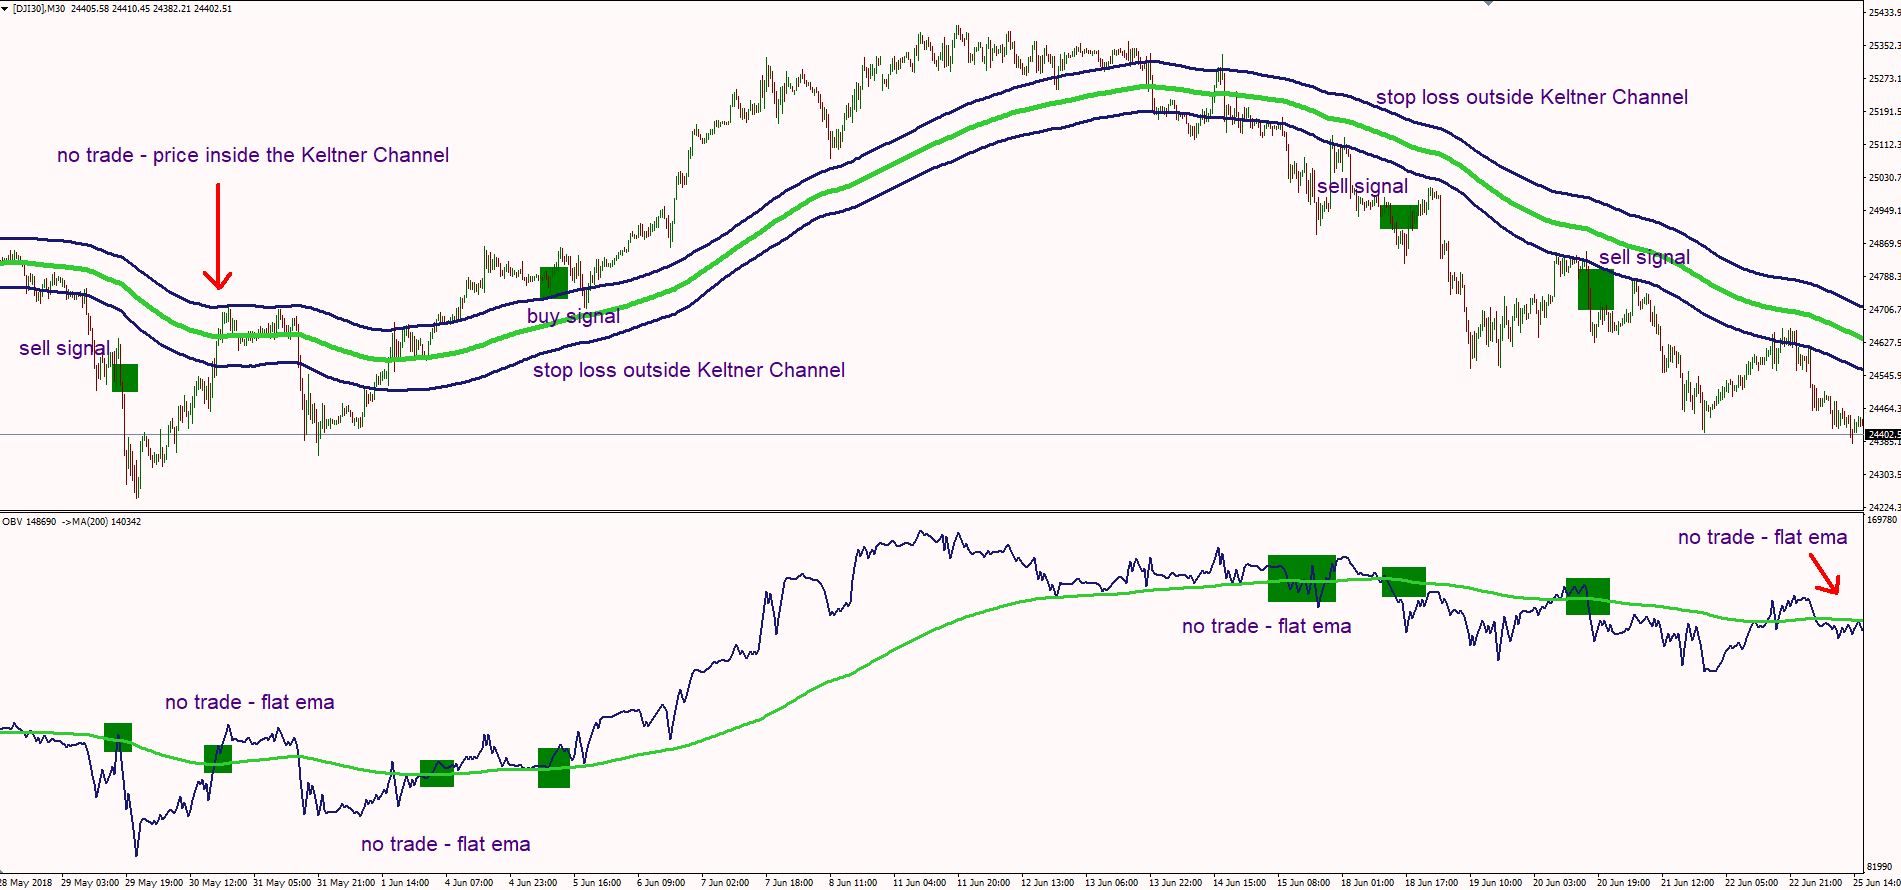
Above we have a Dow Jones Index OBV chart on the 30-minutes timeframe. In this example, we have almost 3 weeks of price action. We have different market cycles: uptrend, sideways price action and finally a downtrend.
During this period, we had 7 relevant crossovers between the volume balance indicator and the 200 EMA. Out of the 7 crossovers, we took only 4 signals.
The first signal was a sell entry, which ended with a small profit.
The next two crossovers were ignored because the price was traded inside the Keltner Channel. When the price is inside the channel, this signals market indecision. So, a crossover between the OBV and the 200 EMA at that time was not relevant.
The 4 signal was a buy entry, which we took, as the Keltner Channel’s slope turned upward and the OBV crossed the 200 EMA.
The next 2 signals were also ignored. The first one was invalid because the price was traded inside the Keltner Channel. The second one was abandoned because the OBV’s EMA was flat. We search for symmetry between the Keltner Channel and 200 EMA plotted on the OBV.
The last 2 signals were valid, and we entered short on both.
As you can see, you can filter a lot of noise with this system, and enter only on relevant movements.
This setup helped us not to trade during the market range which occurred in the middle of the period.
On Balance Volume OBV Indicator – Pros And Cons
- ↑ leading indicator, able to anticipate when major moves in the markets would occur
- ↑ good during a trending market condition
- ↑ good at spotting divergences on the chart
- ↓ offers many false signals when used on shorter timeframes
- ↓ does not contain all of the data necessary for proper analysis of price action, so it must be used in combination with other tools
- ↓ not suited for scalping, as it will generate too much noise







1 thought on “On Balance Volume OBV Trading Strategy: New Formula”
Where can I obtain TSV indicator?