Table of Contents
What is Doji
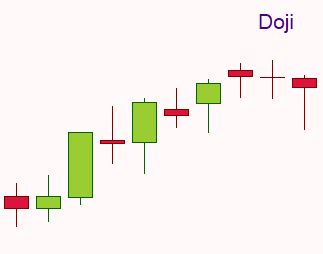
The Doji candle is one of the most famous patterns followed closely by price action traders. A Doji forms when the opening price of a candlestick is the same as the closing price, regardless of the price range.
What Does Doji Candle Pattern Mean
A Doji candle pattern appears when the open price and close price for a determined period are the same, or very close to being the same. The lengths of the shadows can be different.
The perfect Doji has the same open price and close price, however, something must be considered. If the difference between the open and close prices is within a few ticks, this could also be interpreted as a Doji pattern.
When you’re not sure if a candle should be considered a Doji or not, follow the recent price action. If the previous candles had open and close prices within a few ticks, then probably you should not consider the current candlestick as a Doji. If the pattern forms alone, that’s a valid Doji.
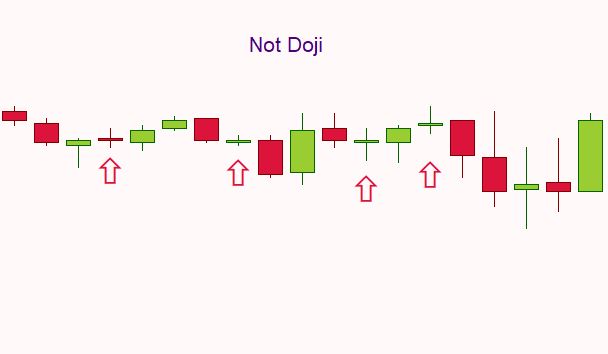
In the example above, we see 4 candlesticks that could be interpreted as a Doji pattern. But, looking at the bigger picture and at the price action as a whole, we should not consider the candles as Doji, as they offer no relevance to the current trend.
As you can see, this interpretation is quite subjective and there are no strict rules but to look at recent price action. A series of very small real bodies as in the chart above would not be interpreted as Doji candles.
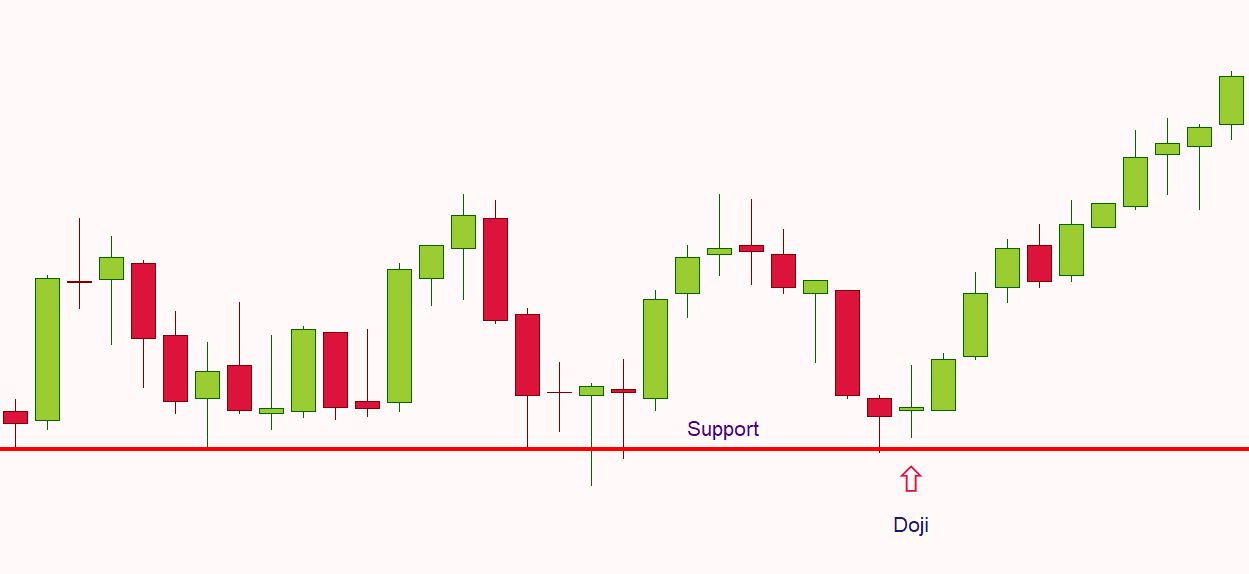
Another technique is based on recent support and resistance levels. If the market is at an important market support or resistance and there are other technical signals, the appearance of an uncertain Doji candle could be interpreted as a Doji.
Look at the chart above, we are at an important level of support, tested 5 times in the past. The highlighted candle could be interpreted as a Doji pattern, as it formed near an important level.
How To Read Doji Candlestick
Doji Meaning Market Indecision
One of the most important values of a candlestick chart is the ability to read market sentiment. A Doji candle is the perfect example for reading market sentiment. This pattern is an outcome of indecision in the market. A Doji candlestick suggests a lack of control in the market either by the bulls or the bears.
The lack of direction is clear: bulls moved prices higher, bears moved prices lower, but in the end, the market price closed exactly or very close to where it opened.
Now, if the Doji candle highlights market indecision, it is safe to say that it does not offer insight into whether bulls or bears are in control. You have to guess the market’s next direction.
So, the first thing you should remember after reading this article is to use Doji candle in combination with other technical indicators or price action, never on its own.
Doji Candle Meaning Possible Reversal
Doji candle offers traders an early warning that there may be a change in market momentum or a possible change in direction if current conditions don’t change.
Please remember that the “possibility” of a change of direction does not represent a guaranteed change of direction. The truth is that we don’t know if a trend is exhausted. We don’t know the exact moment when the trend is going to end. A Doji will not guarantee that a certain setup will occur or that the market will reverse.
Traders incorporate Doji in their analysis in an effort to try to predict future price movements. They try to get the probabilities in their favor as much as they possibly can.
So, a Doji candle by itself is not significant enough to predict a reversal in prices, it represents only a warning of an impending trend change.
Steve Nison, the person that introduced candlesticks to Western traders, affirmed that Doji candles tend to be better at indicating a change in trend when they occur at market highs instead of at market lows. This could be explained by the fact that for an uptrend to continue, new buying power must be present on the market, while a downtrend could continue at full strength without becoming weaker.
Doji Pattern Near Support And Resistance
Doji candles formed at relevant market highs or lows can sometimes turn into support or resistance areas.
When forms in the middle of a trend or trading range, a Doji candle has little significance. Doji candles are commonly met during periods of consolidation and can help traders to spot potential price breakouts.
When it forms near round numbers or around previous levels of support and resistance, pivot points or Fibonacci retracements, Doji candles offer traders decent entry points.
Doji Candle Pattern – Types
There are five different types of Doji candles:
- Common Doji
- Gravestone Doji
- Dragonfly Doji
- Long-legged Doji
- Rare Doji
Common Doji
A Common Doji is the candlestick pattern we talked before. A Doji candle pattern appears when the open price and close price for a determined period are the same, or very close to being the same.
Gravestone Doji
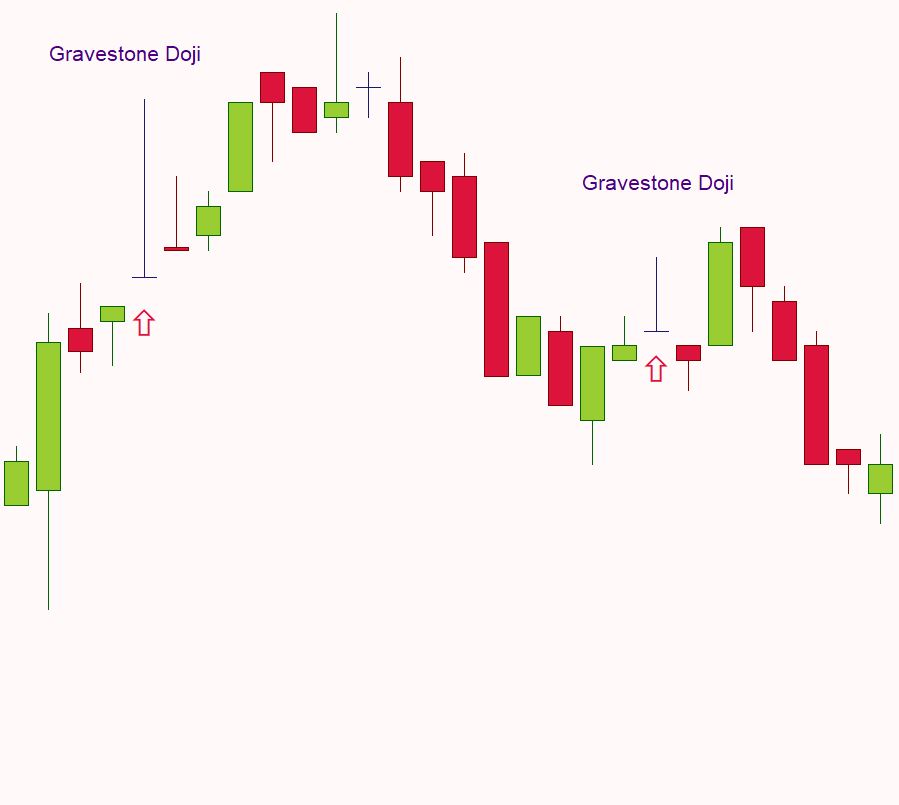
A Gravestone Doji forms when the Doji is at, or very near, the low of the period. As the upper shadow is quite long, this means that the Gravestone Doji is a bearish pattern.
The bearish outlook of the pattern is evident: the price opened and traded higher all the period, but closed where it opened, which also coincides with the low price for the period.
Gravestone Doji can be interpreted as a failed rally.
Traded by itself, this pattern is not profitable. Just look at the picture above, the price indeed declined after the appearance of a Gravestone Doji, but not before taking some stop-losses on its way. That’s why it’s better to trade this pattern near strong support and resistance levels and in combination with other indicators.
Dragonfly Doji
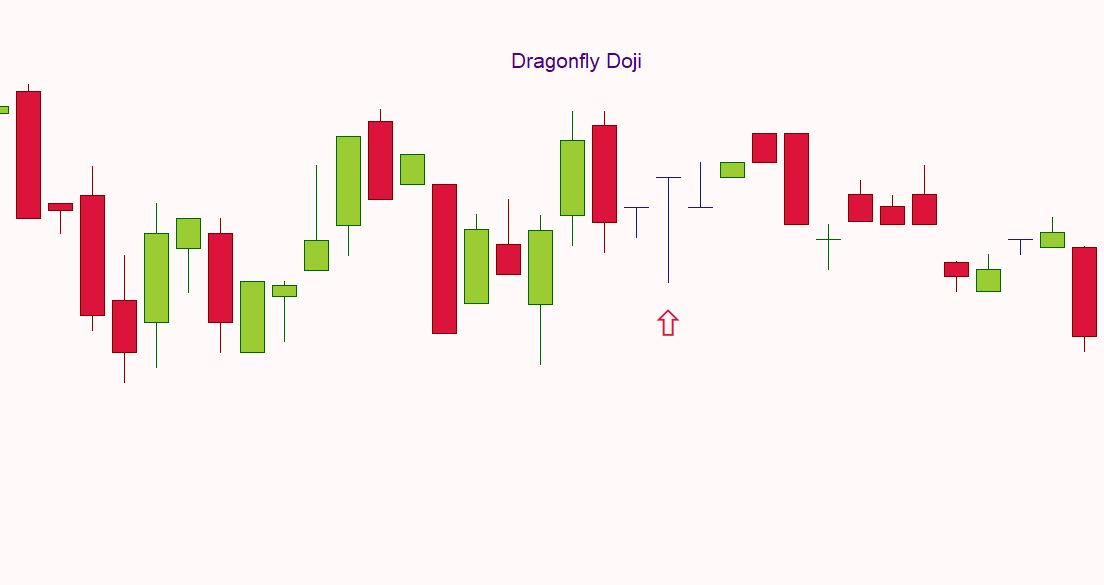
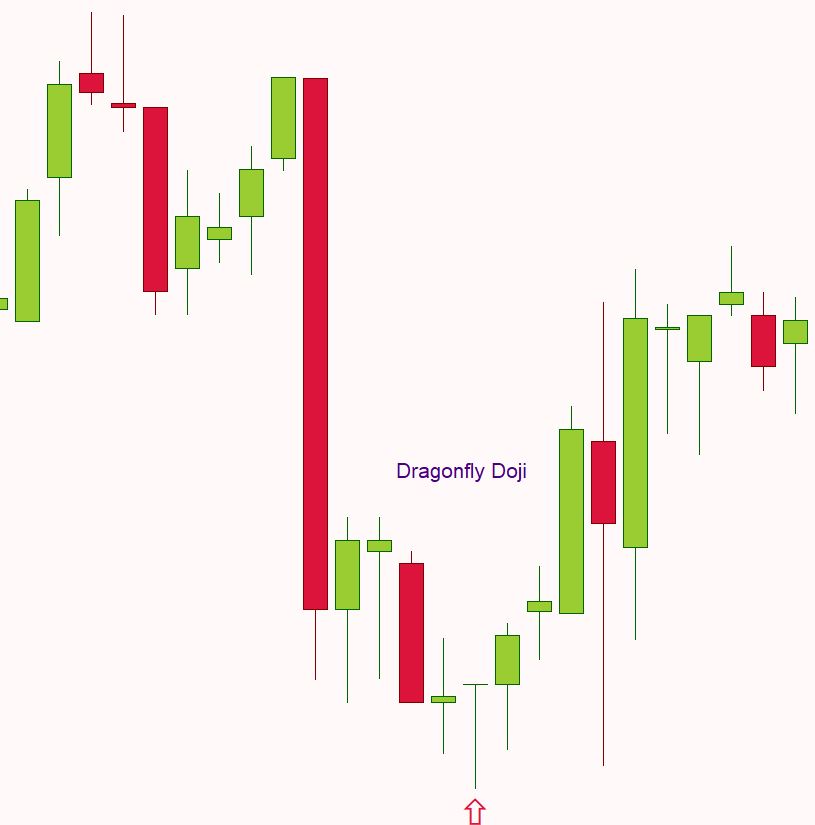
The Dragonfly Doji forms when the open price and close price are at the high of the period. As this pattern has a long lower shadow this means that Dragonfly Doji is a bullish pattern.
The bullish outlook of the pattern could be explained as follows: the price opened and traded lower all the period, but closed where it opened, which also coincides with the high price for the period. This means that despite the selling pressure, the bulls entered the market strong and pushed the price back up.
As in the case of Gravestone Doji, this pattern is not profitable when traded by itself. If we look at the picture above, the Dragonfly Doji pattern formed near an important level of support, which indeed drove the price higher. That’s why it’s important to trade this pattern near strong support and resistance levels and in combination with other indicators. I don’t trade the Doji patterns in the “conventional” way and I’ll explain to you why later in this article.
Long-Legged Doji
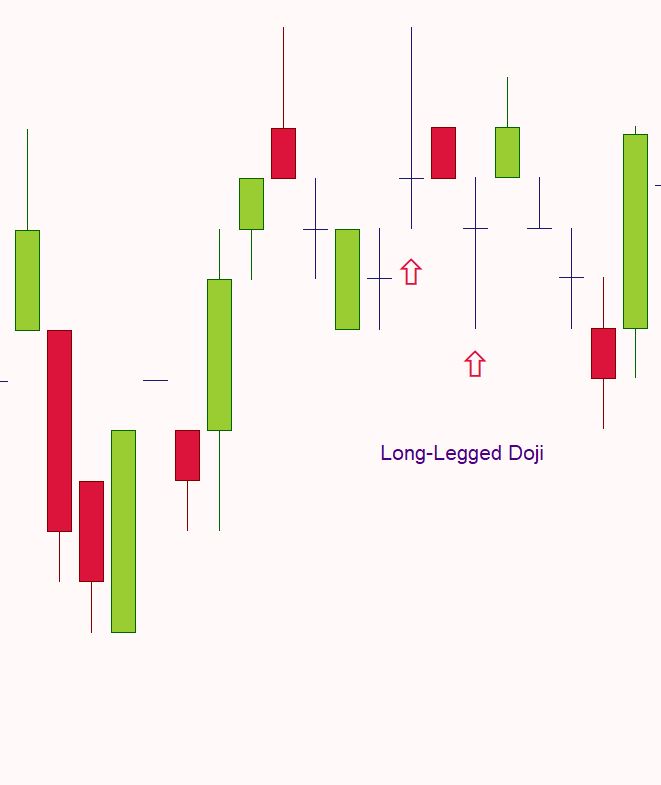
The Long-Legged Doji has long upper and lower shadows in the middle of the period’s trading range, reflecting the indecision of buyers and sellers.
Throughout the period, the market moved higher and then sharply lower, or vice versa. It then closed at or very near the opening price. This signals market indecision, as neither the bulls nor the bears won the battle.
Long-Legged Doji candles will offer many false signals and should only be traded on higher time frames and in combination with other technical indicators.
Rare Doji
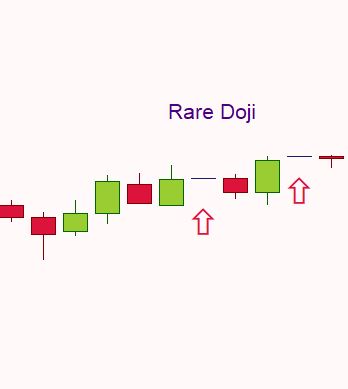
The Rare Doji occurs the open, high, low, and close of the price are all the same. This pattern forms when a market is very illiquid or the data source did not have any prices other than the close.
The Rare Doji pattern should be interpreted as a complete and total uncertainty in the market direction.
How To Trade Doji Candle Pattern – Signals and Trading Strategies
Double Doji Trading Strategy (2 Dojis)
As we previously explained, a Doji candle pattern doesn’t tell you a lot by itself. It only tells you that the market is undecided.
If you take the classic signals taught by most ‘teachers’ and sell a Doji candle in an uptrend and buy a Doji candle after a downtrend, your account will diminish slowly.
There is a conservative technique through which you can make this pattern generate some good, valid signals. I call it “the double Doji system” and is basically a breakout method, in the direction of the main trend.
The reality is that only one Doji will mark the end of an uptrend or a downtrend and other 9 Doji candles will generate false signals. By the time you’ll get your good signal, you will be frustrated and down 20% in your account.
So, the better solution of trading with Doji candles is to trade in the direction of the main trend. And not with one Doji candle, but with two dojis.
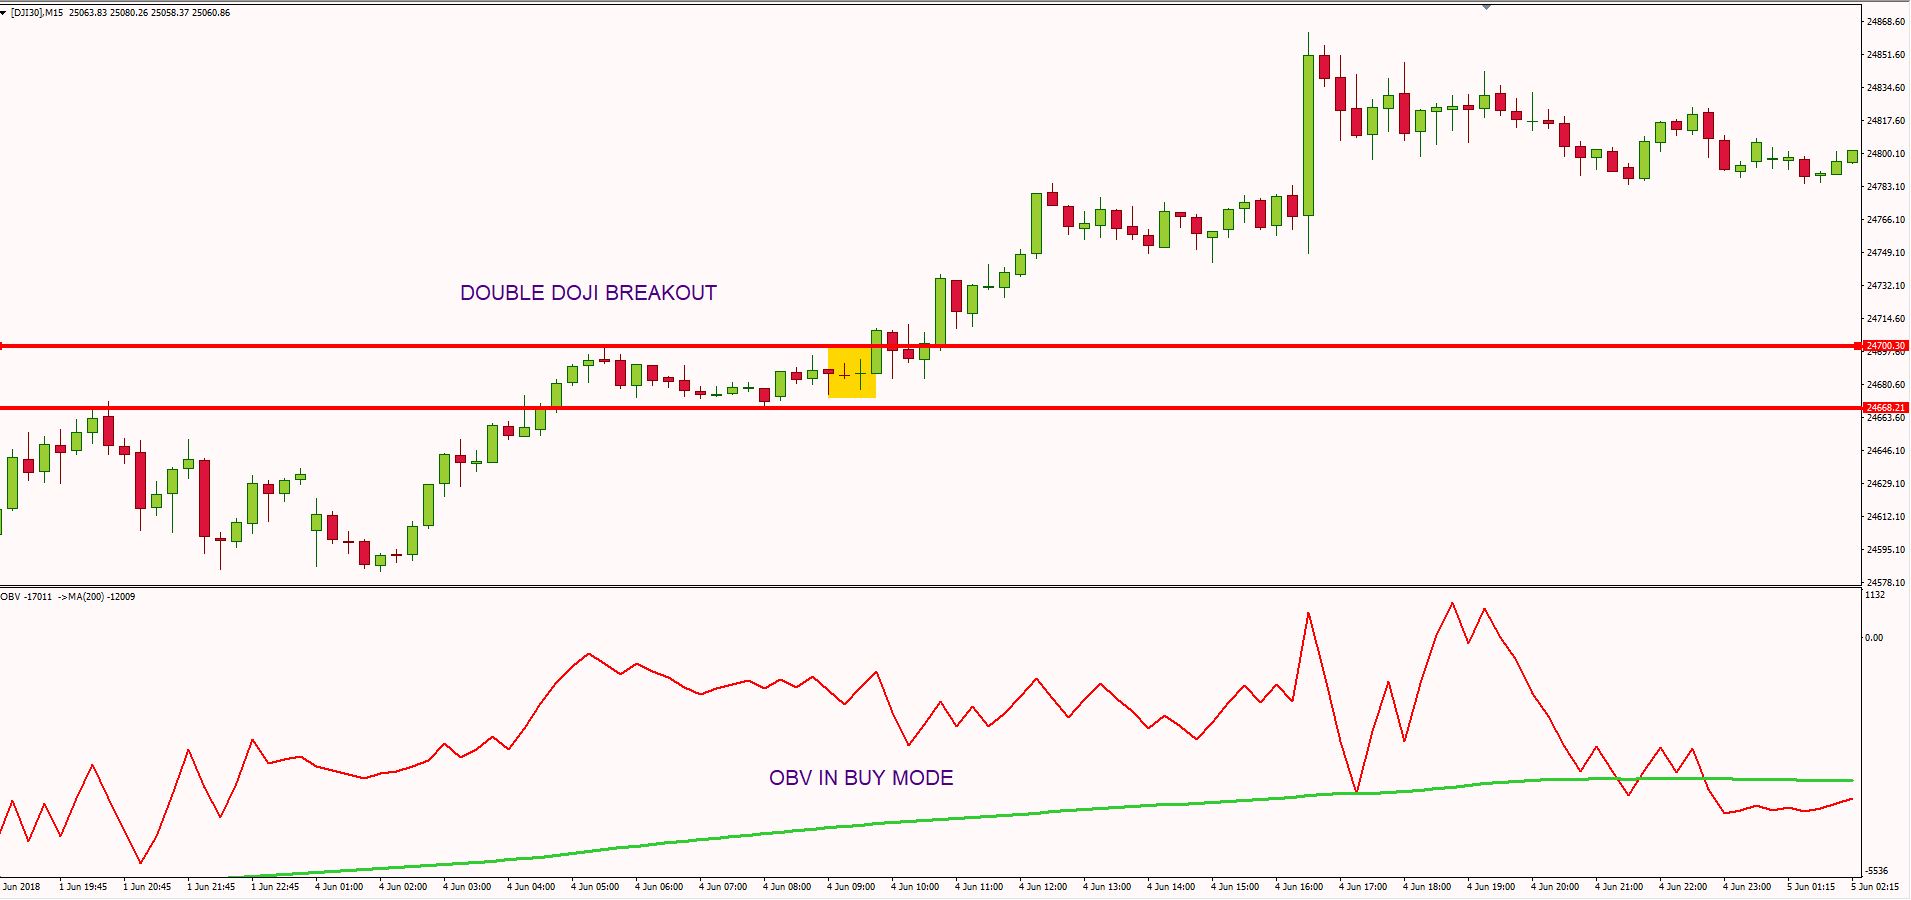
Let’s look at the chart above. The system is pretty simple. We have to identify an area with 2 Doji candles, and we are basically trading a breakout in the direction of the prevailing trend.
The main trend is determined by the crossover between the on-balance volume and the 200-period exponential moving average. You can determine the trend with other indicators, depending on your preference. I like to use minimum one leading indicator in my trading setup, and the on-balance volume is perfect for that.
We have to spot the recent market highs and lows around the two Doji candles and wait for a trade in direction of the main trend. If the breakout occurs in the other direction, we ignore the signal and move on to the next setup.
If we analyze the Dow Jones Index chart above, we see that we have an area with 2 Doji candles. The “classic way” to trade this chart would be to short the Doji pattern. And it would be wrong.
Instead, we entered long on the market once the price closed above the trading range and retested the previous resistance level, which became support.
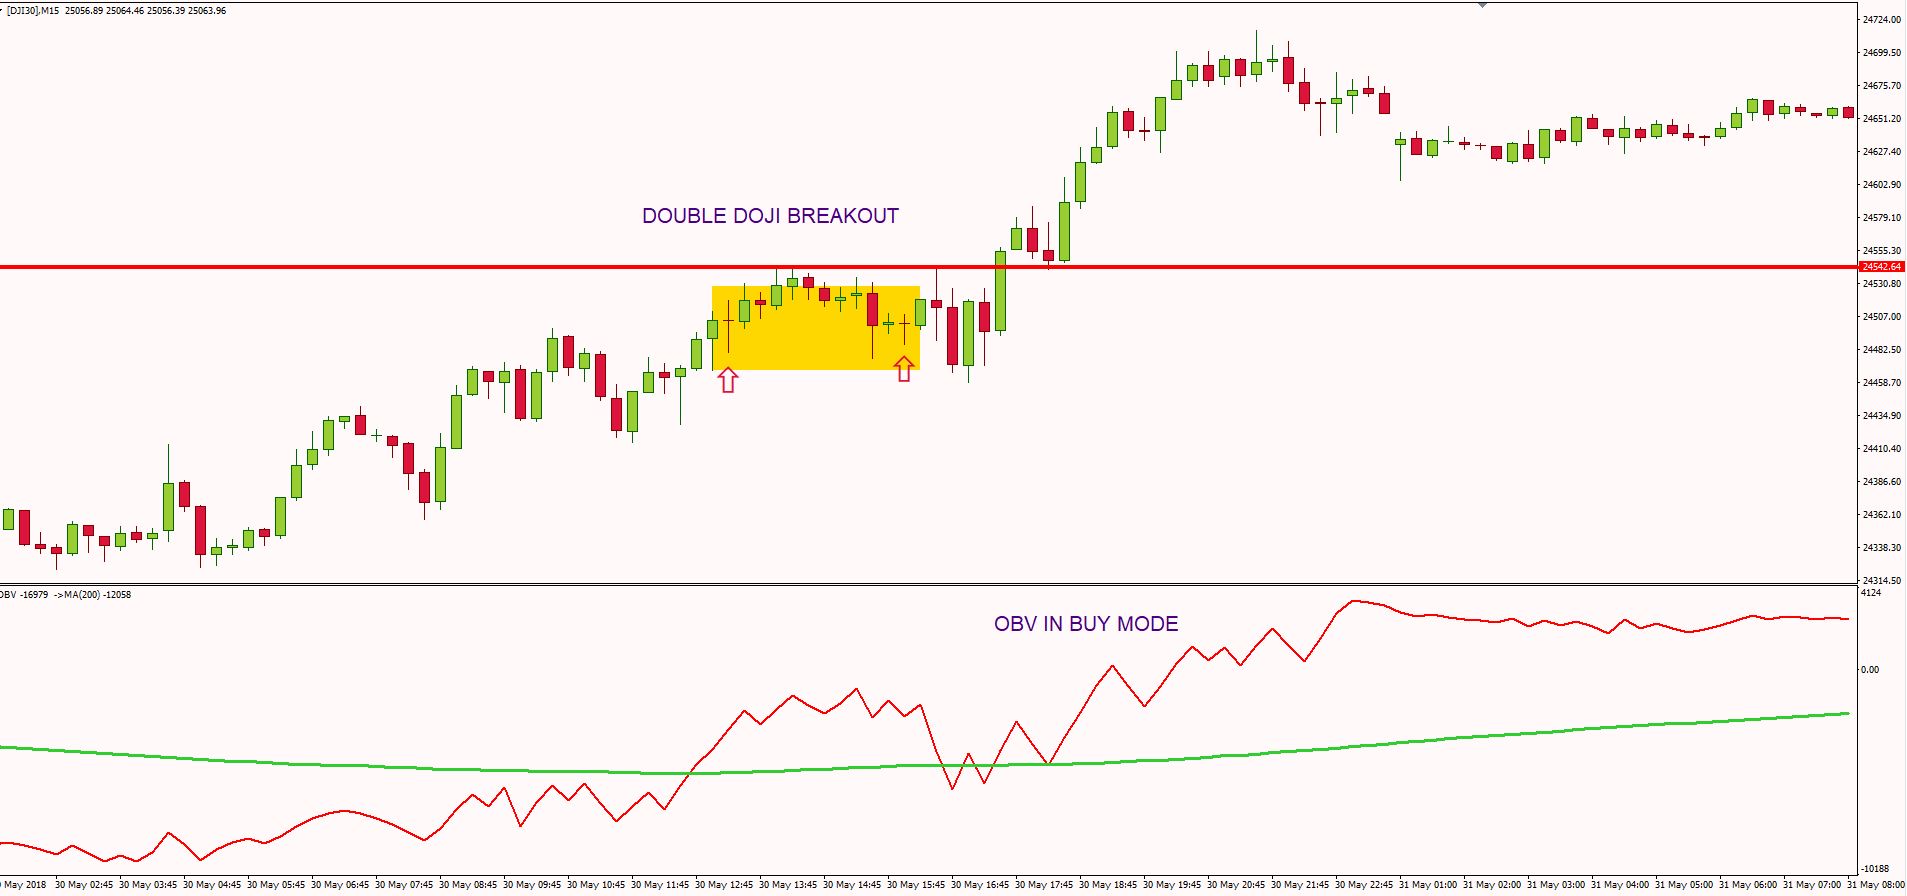
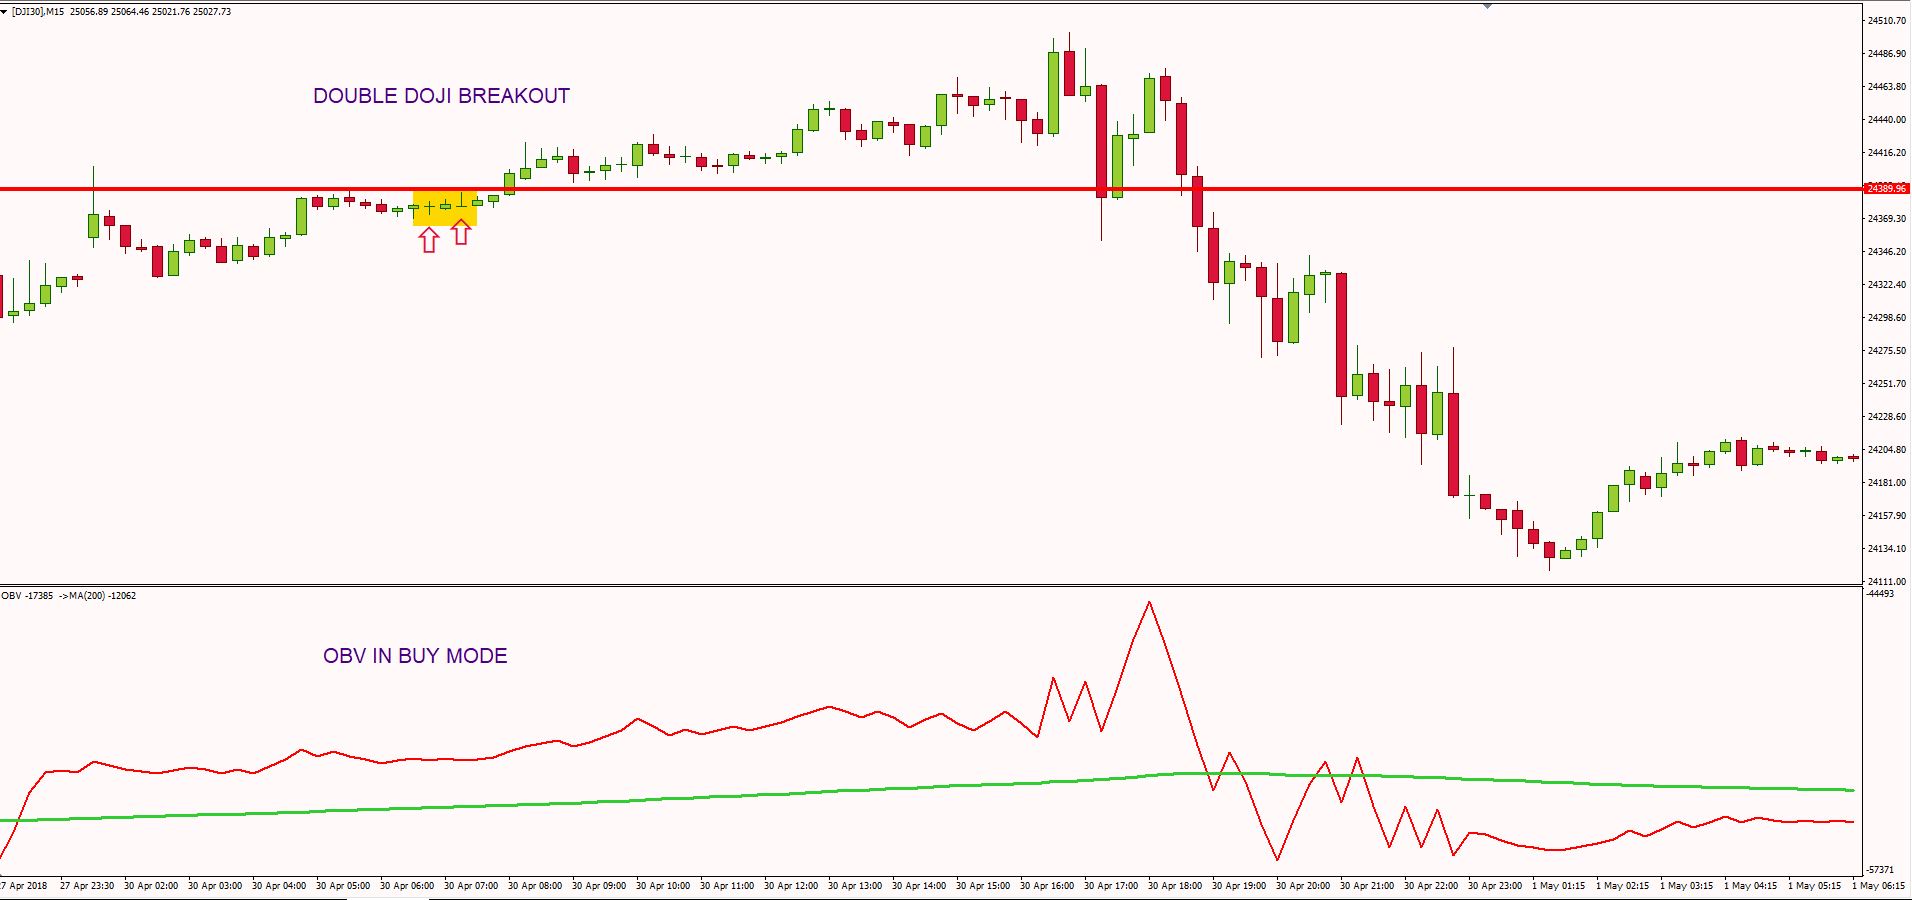
Here’s another example. The same setup occurred, and despite the fact most traders would be tempted to short the market, the wiser entry would be on the long side of the market. We wait for the breakout, we confirm it with the on-balance-volume and we enter the market at the retest of the previous resistance level.
In what concerns the stop-loss and take-profit levels, things are relatively easy. I set my stop-loss order below the two Doji candles and I aim for a 2:1 risk/reward ratio.
You could also adopt another technique. Once the price reaches 50% of your target take half of your position, move your stop-loss order to break even and ride the trend.
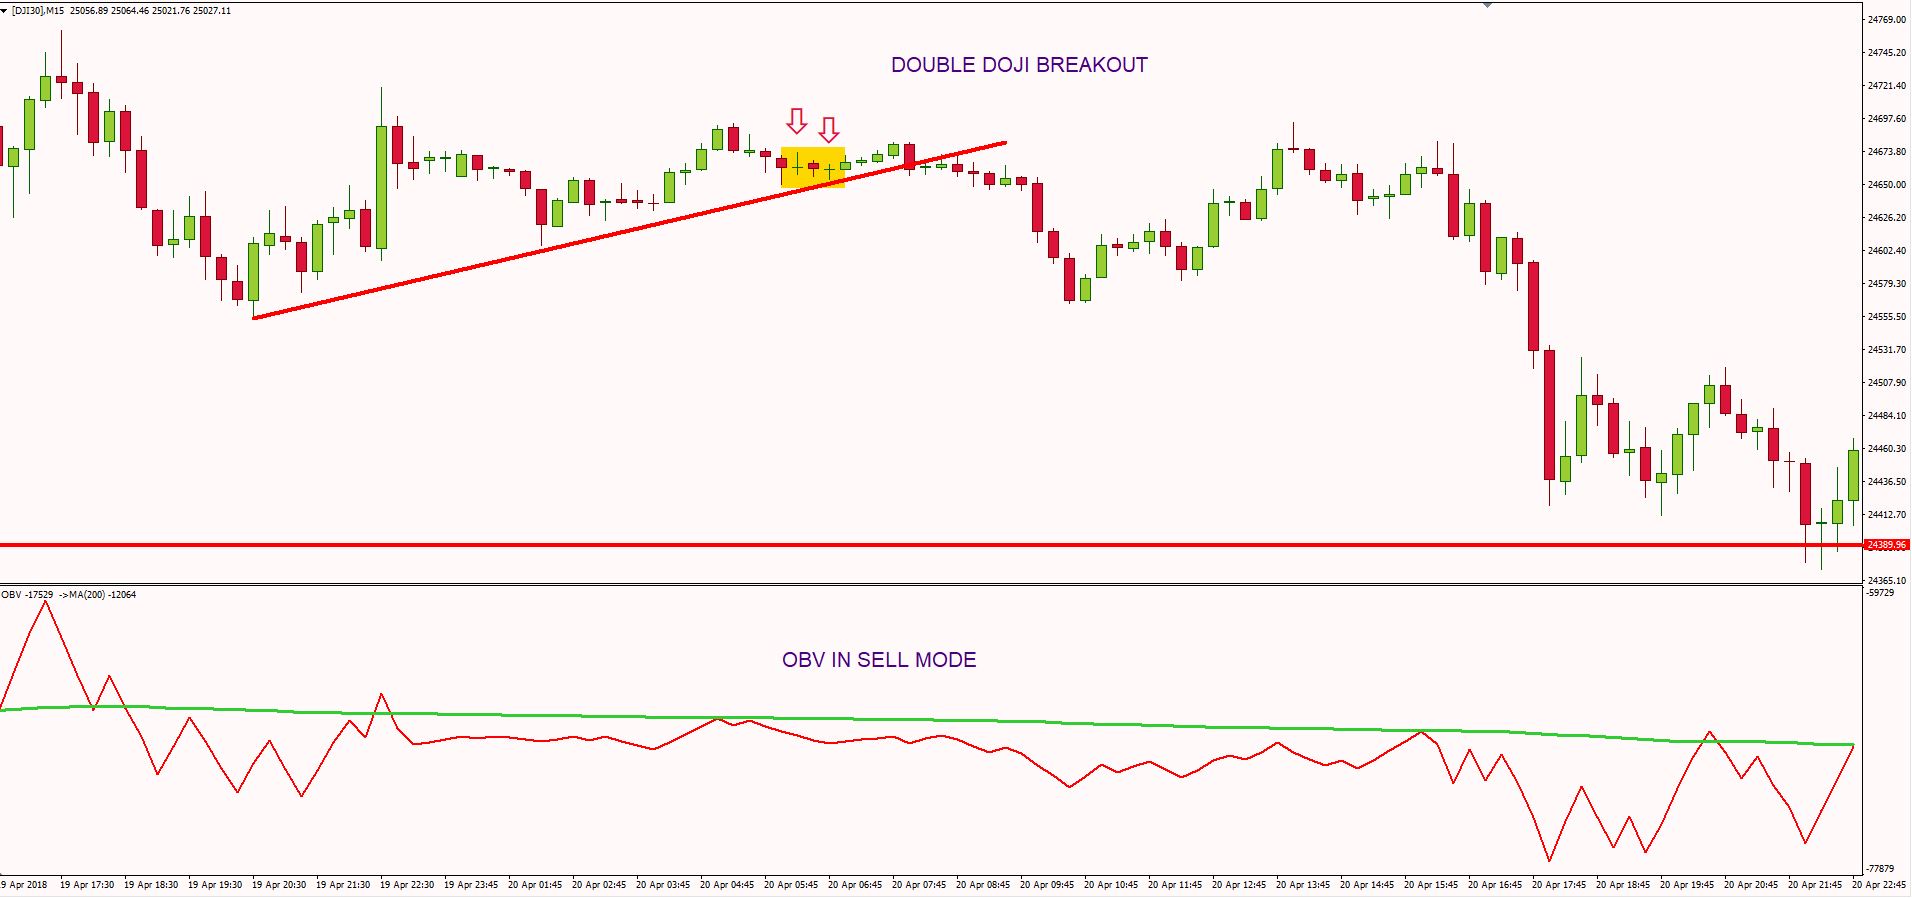
Let’s also look at a short trade. This time, we waited for the breakout of a trend line. The on-balance volume indicated a downtrend, the price closed below the trend line, so we were safe to short the market.
The stop-loss order was placed above the two Doji candles and the take-profit level near the previous market low.
Doji Technical Analysis
By now, I hope I’ve convinced you not to trade Doji candles in the “old” way. Predicting market tops and bottoms is an extremely hard job for a trader, and Doji candles won’t help you to forecast them.
After all, a Doji candlestick is a lagging indicator, it follows the price. Doji candlestick doesn’t have predictive powers, as others may suggest. It just signals market indecision.
Many traders use Doji candlesticks as a tool to identify certain areas where buyers or sellers are coming into the market. The reality is no one can anticipate or predict what market participants will do next. So, instead of picking tops and bottoms, it’s wiser to use Doji candles to trade with the trend.
Think about it, if a Doji candle signals indecision, why would you interpret this as a signal to enter in the opposing direction? I prefer to consider Doji candles as accumulation zones where bull or bears are gaining momentum for a continuation of the main trend.
And always combine this pattern with other technical tools, to confirm the main trend. From my experience, support and resistance, channel trading and breakout trading work best with Doji candles.






1 thought on “Doji Candle Pattern Trading Strategy: The Power Of Dojis”
I have going through your analysis and they have been so helpful. Thank you so much for sharing your knowledge to benefit people like me. However, one request from me. I trade with Alpari MT4, and I am having the following challenges;
1. Alpari MT4 does not have EMA in the list of its indicators.
2. When I decided to use the SMA in place of EMA, I do not know how to build it into the OBV chart as you use in your illustrations.
Kindly give me a solution these challenges as listed above.
Thanks.
From Nigeria ( McChris Anele)