Table of Contents
What Are Bollinger Bands
Bollinger Bands, invented by John Bollinger in the 1980s, are a popular tool used by traders to analyze the markets. Bollinger Bands consists of 3 parts (all lines):
- The middle band, representing a simple moving average (most common value is 20)
- The upper band, which is the period + N standard deviations (usually 20 + 2 STD)
- The lower band, which is the period – N standard deviations (usually 20 – 2 STD).
The middle band basically serves as a base for both the upper and lower.
How To Read Bollinger Bands
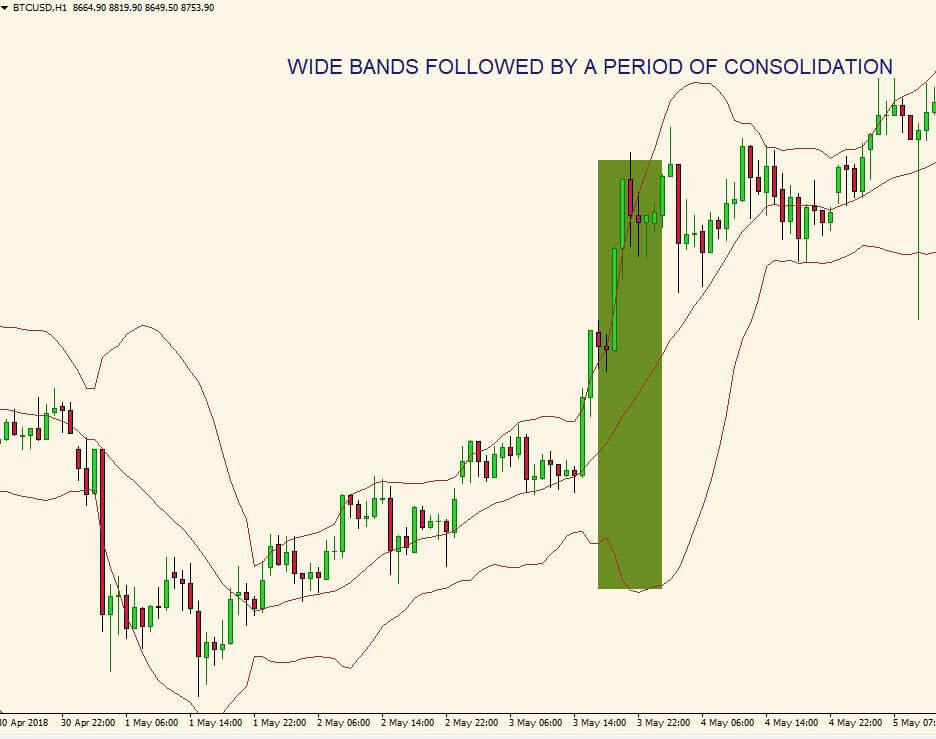
Bollinger Bands are a trend indicator that detects the volatility and dynamics of the price on the market. The bands contract when the market volatility is low and expand when volatility increases. During periods of low volatility, the bands are narrow, while during periods of high volatility Bollinger Bands expand drastically.
The general consensus is that when the price reaches the upper band it is considered as overbought and when price approaches lower band it is considered oversold.
How To Calculate Bollinger Bands
The upper band of the Bollinger Bands is a standard deviation multiplied by an input factor above the simple moving average, while the lower band is the standard deviation multiplied by the same input factor below the simple moving average.
The standard deviation is a statistical measure adapted for the technical analysis through Bollinger Bands. The standard deviation is basically a number expressing how much the values of the price differ from the mean value.
Bollinger Bands Best Settings And Values
Prices will distribute around the simple moving average:
- Around 65% of price action is contained within 1.0 standard deviation of the Bollinger Bands
- Around 95% of price action is contained within 2.0 standard deviation of the Bollinger Bands;
- Almost 99% of the price action is contained within 3.0 standard deviation of the Bollinger Bands.
Now, I don’t know about you, but I prefer to trade with the odds in my favor. So, if a standard deviation of 3.0 will offer me around 99% certainty that the price won’t exit the Bollinger Bands, then I will be interested to trade only with these settings.
Depending on your trading style, you can use different values of the Bollinger Bands:
- Scalpers would use the Bollinger Bands with a 10 period moving average with 1.5 standard deviations;
- Day traders would use the Bollinger Bands with a 20 period moving average with 2 standard deviations;
- Swing traders would use the Bollinger Bands with a 50 period moving average with 3 standard deviations;
- Position traders would use the Bollinger Bands with a 200 period moving average with 3 standard deviations;
Lower settings on the Bollinger Bands will generate more trading signals, but will also increase the number of false signals, as the price movement will exit more often from the bands.
On the other hand, a 2.5 standard deviation Bollinger Bands or even a 3 standard deviation will generate fewer trading signals, but high-probability signals.
How To Trade Bollinger Bands | Signals and Trading Strategies
How To Use Bollinger Bands As Dynamic Support & Resistance Levels
The upper and lower bands can act as dynamic resistance and support levels, as traders generally avoid buying when the asset price hits the upper Bollinger band, respectively avoid selling whenever the price reaches the lower Bollinger band.
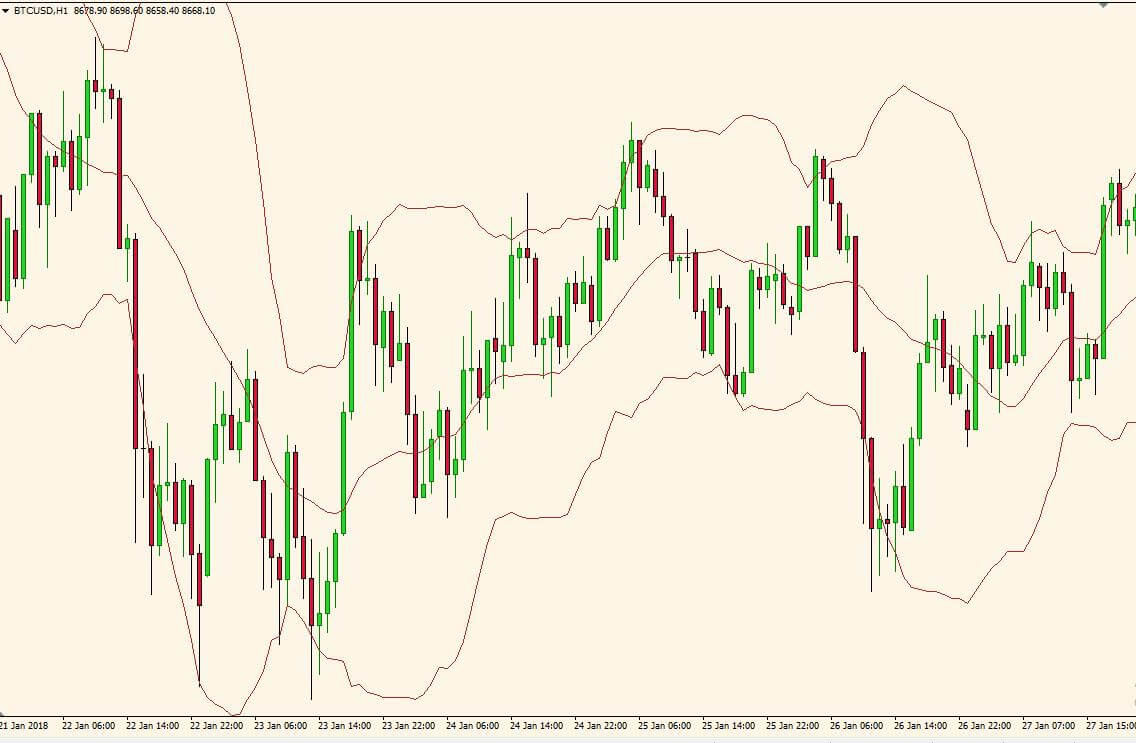
In a sideways market, when there isn’t a clear trend on the chart, Bollinger Bands provide excellent support and resistance, as most traders believe that there’s a 95% chance of prices staying within Bollinger Bands.
As we can observe in the previous Bitcoin chart, during sideways price action, Bollinger Bands serve as a pretty accurate dynamic support/resistance indicator, and the price barely exceeded the bands.
Trading With Bollinger Bands To Find Overbought & Oversold Levels
Bollinger Bands are a good indicator to determine overbought and oversold levels on the charts. When the price reaches the upper band/lower band, the chances of the price going further up/down decrease, but this does not mean that traders must enter opposite positions.
However, touches of the bands are just that, are not signals. A touch of the upper Bollinger Band is not a sell signal and a touch of the lower Bollinger Band does not represent a buy signal.
Here is why most traders fail with Bollinger Bands indicator: they use the bands to enter the market in overbought or oversold conditions. Yes, in a non-trending market, this approach works, but in a trending scenario Bollinger bands indicator lose its significance and will give many false signals.
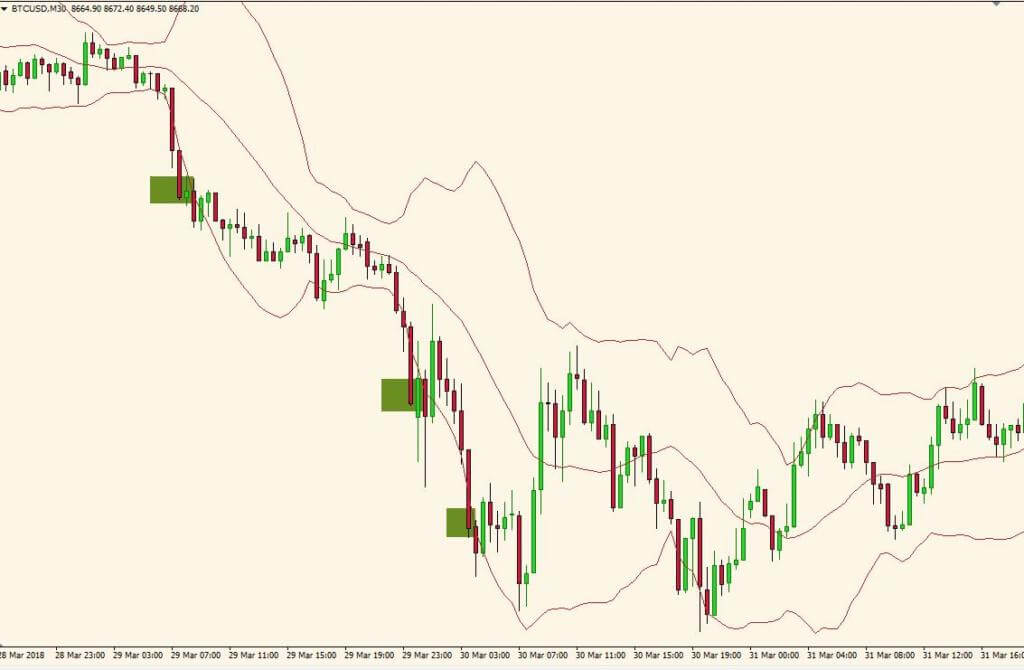
We can observe in the previous Bitcoin chart, that during a downward trend, Bollinger Bands offered 3 oversold signals, but none of them were accurate. In fact, closes outside the Bollinger Bands are initially continuation signals, not reversal signals. So it’s best to avoid chasing tops/bottoms with Bollinger Bands and use the indicator in conjunction with other oscillators.
TIP: The smarter use of the bands in a strong bullish/bearish market, when the price is moving along with upper/lower band and then moves towards middle band is to enter in the direction of the trend when the price trades around the middle band.
Used in combination with other oscillators like Stochastic, the bands will filter a part of the false signals.
Bollinger Bands Volatility Trading
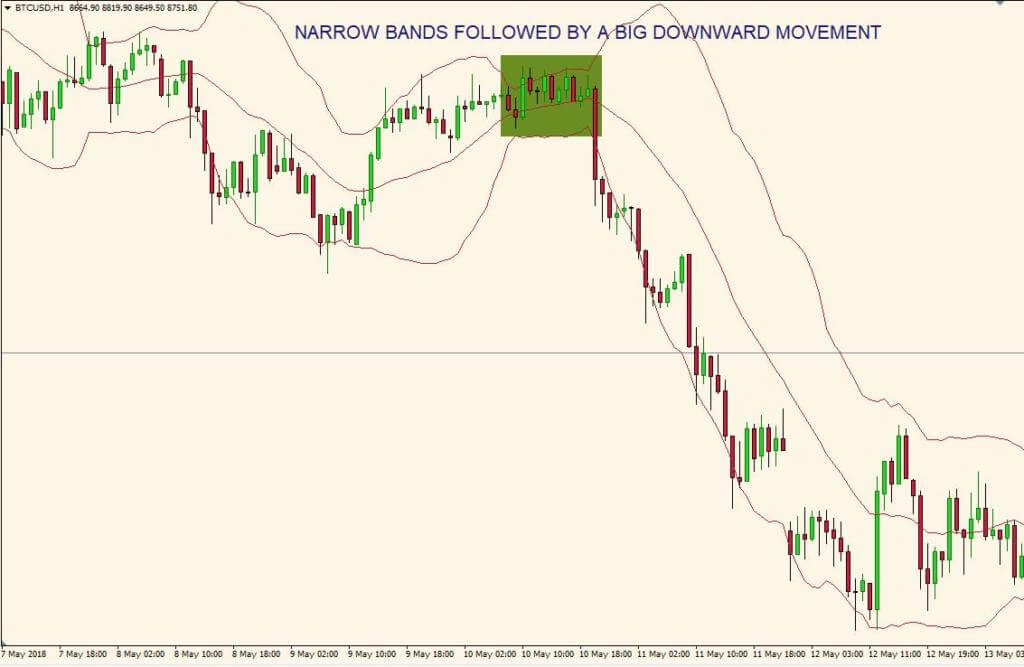
As we previously mentioned, Bollinger Bands indicator measures the volatility on the market. The wider the band, the more volatility it has. A narrow band means indecision on price movement and when this happens, it is almost always guaranteed that markets are about to move either up or down. Also, if the market has recently experienced a lot of volatility and the bands are far apart, this is a sign that the market will settle down and trade into a range in the near future.
Forex Trading Strategy: How to Use Bollinger Bands for Scalping
Scalping became a very popular trading method in recent years. This trading technique is used by both experienced traders and market beginners. The main aim of scalping is to obtain small incremental gains that add up to a large profit, rather than big gains from a small number of trades.
This method involves holding positions for just a few seconds or minutes, at the most.
The Bollinger Bands, measuring volatility, is a great indicator for taking small portions of profit from the market.
A solid scalping trading technique which includes the Bollinger bands must use other indicators to pinpoint our market entries.
I use a moving average for trend determination and the Stochastic indicator for market entries. 3 Indicators, each one of them is measuring a market force:
- Bollinger Bands – volatility
- Moving average – trend
- Stochastic Oscillator –momentum
The main principle being this technique is simple. We want to search for low volatility periods, in the direction of the short-term market trend, to position ourselves for scalping a few points.
Here are the main guidelines that you should follow:
- We will use this setup on the 1-min chart on a low spread instrument ( EUR/USD, Dow Jones Index or DAX30 Index)
- Plot the Bollinger bands with a 50-period moving average and a standard deviation of 3 ( this is the best Bollinger Bands setting for scalping)
- Search for periods when the Bollinger bands are PARALLEL with each other
- Plot the 1000-period exponential moving average. 1000 EMA on the 1-min chart is the same with 200 EMA on 5-min chart. Basically, we are trading with 200 EMA on the 5-min charts
- If the price trades above the 1000-exponential moving average, we consider taking only BUY signals. If the price trades below the 1000-exponential moving average, we consider taking only SELL signals
- We want the price to trade near the lower Bollinger Band when the price trades above the 1000-period exponential moving average for a BUY signal
- We want the price to trade near the upper Bollinger Band when the price trades below the 1000-period exponential moving average for a BUY signal
- We time our entry with a Stochastic crossover
- We aim for 5-10 points, although you can obtain much more from the market if you decide to use a trailing stop
- The stop-loss order is located outside the Bollinger bands
If it sounds complicated, it isn’t. Let’s throw in some charts.
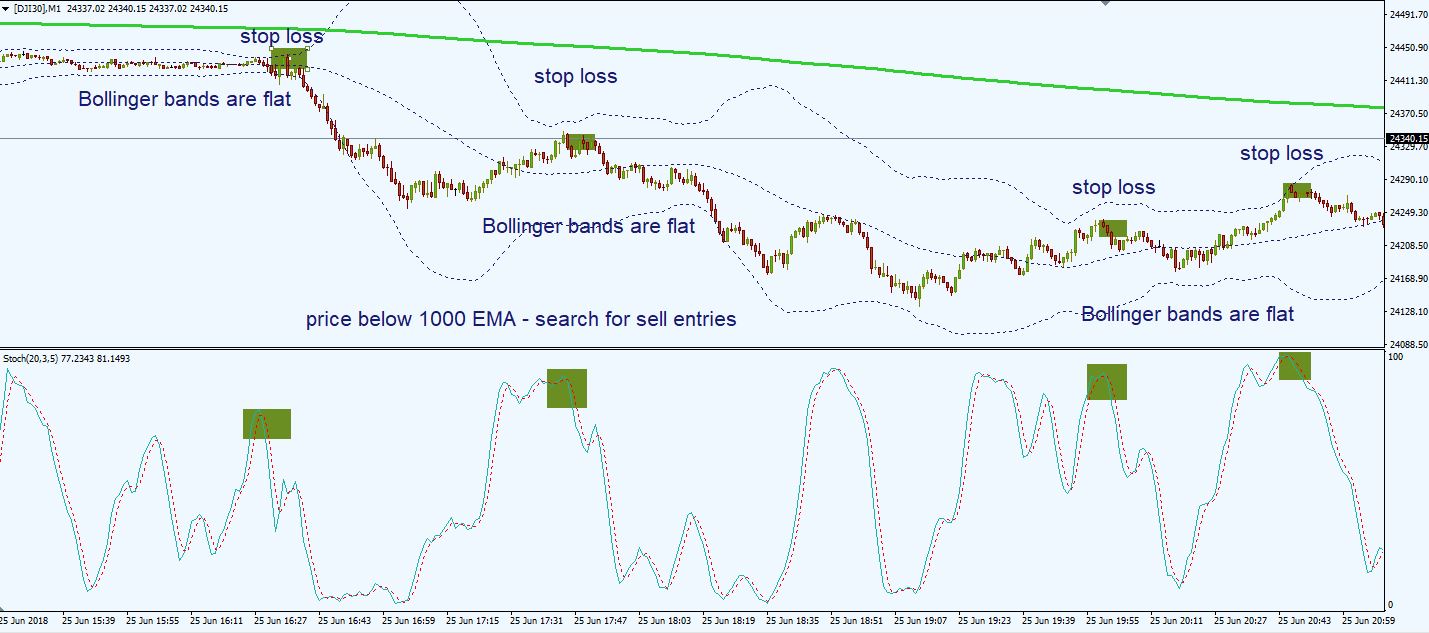
We have a Dow Jones 1-min chart with the indicators plotted on it.
As the price trades below the 1000-period exponential moving average, we start looking for short positions only.
Once we know we are interested in short entries, we are looking for the price to trade near the upper Bollinger Band. We also prefer the Bollinger Bands to be flat, or parallel. However, this is not a deal-breaker. If the momentum drives the price near or outside the upper Bollinger band, we could take this trade also.
When the price reaches this area, we look at the Stochastic Oscillator to enter the market. Ideally, we want the Stochastic to be in an overbought area. If not, a divergence on the Stochastic would be also a great confirmation.
As you can see, this setup generated 4 valid short positions.
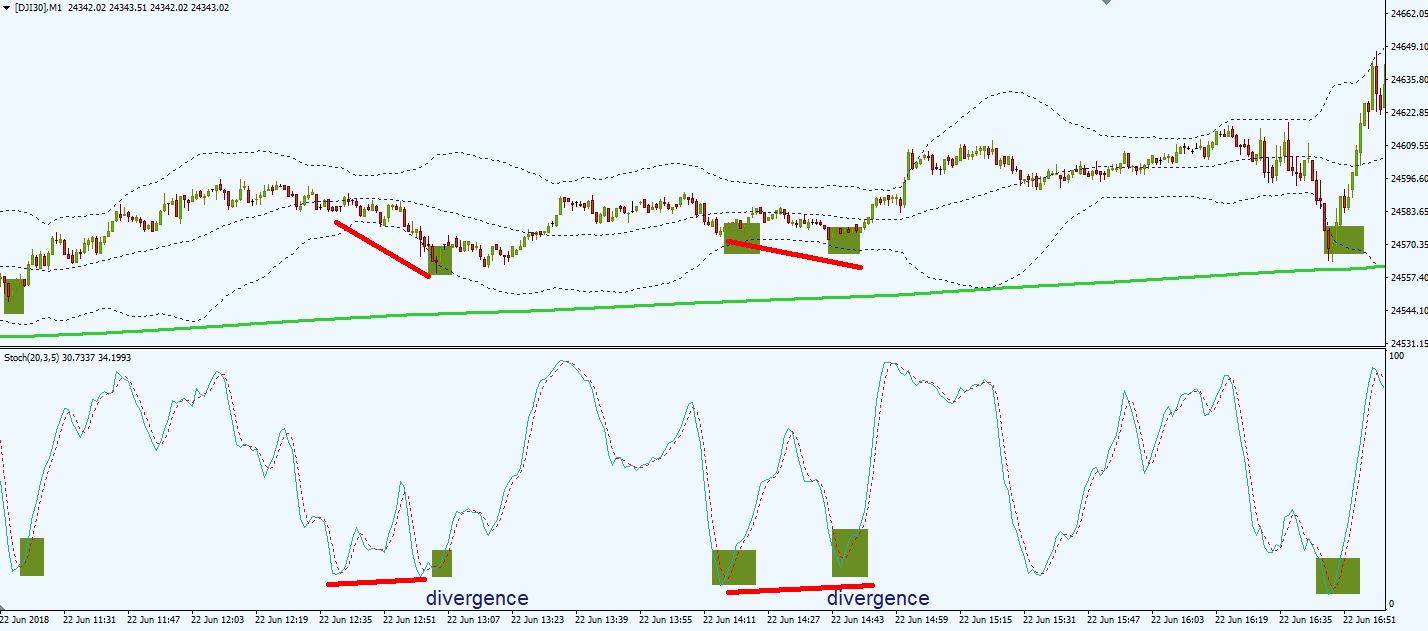
Here’s another chart, this time we have a buy scenario. As you can see, we are in a minor uptrend, but the market mainly trades sideways.
Once the price nears the lower Bollinger Bands, we start looking at the Stochastic Oscillator, to determine if it’s a good buying opportunity.
This time, the signals were more obvious. We had 5 valid long opportunities, all of them being successful.
As you can see, we also had some divergences on the Stochastic oscillator. Divergences acted as a catalyst for the price to reject the Bollinger Bands.
The main advantage of this scalping setup with the Bollinger bands is that you can use in all market conditions. You CAN trade this system during range markets. This is not a trend-only system.
Bollinger Bands Trading Strategy for Day Trading The Forex Market
If scalping is not your main trading technique and you prefer day trading, Bollinger Bands can also help you take better trades.
In day trading, Bollinger Bands indicator works well with other oscillators indicating overbought or oversold areas. One of them is the commodity channel index (CCI).
The Commodity Channel Index (CCI) is an oscillator used in technical analysis in order to measure the variation of a security’s price from its statistical mean.
This setup involves a crossover between the CCI and a moving average, based on the price action around the Bollinger Bands.
In order to smooth the signals offered by the Commodity Channel Index indicator, I prefer to add a moving average on the indicator. By adding a moving average on the CCI chart window, I’m interested in taking crossover signals, for better quality signals.
Now, a crossover between the CCI oscillator and a moving average will catch good movements when markets are trending. When markets are trading in a range, this system is subject to whipsaws, which will lead to losing trades.
That’s why we’ll use the Bollinger Bands, to determine the correct market entries and the market direction.
Here are the main guidelines that you should follow:
- We trade this day trading setup on the M15 chart
- Plot the Bollinger bands with a 50-period moving average and a standard deviation of 3
- Plot the 50-period Commodity Channel Index (CCI) indicator. We use a higher number of periods on the CCI in order to smooth the indicator. We want fewer signals, but quality ones.
- Add a 200-period exponential moving average on the CCI, not on the price chart.
- We aim to trade the crossover between the CCI and the moving average. Long positions when the CCI crosses above the 200 EMA, above the 0 level. Short positions when the CCI crosses below the 200 EMA below the 0 level.
- We take a long signal only if it occurs above the middle Bollinger Band – this way, we know that we have buying pressure on the market
- We take a short signal only if it occurs below the middle Bollinger Band – this way, we know that we have selling pressure on the market
- The stop loss will be placed below the Bollinger bands, or below a relevant recent market swing
- We aim for the price to trade near the upper Bollinger band for a long entry, or near the lower Bollinger band for a short position
Let’s look at some charts.
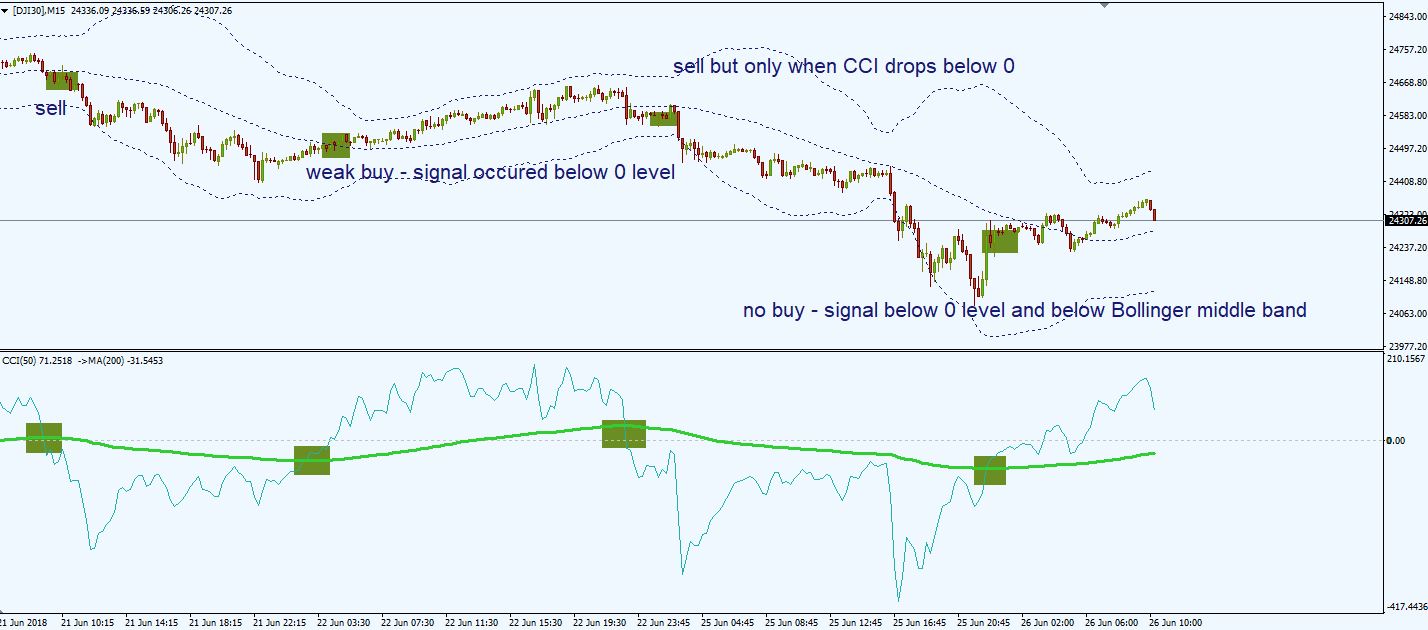
Let’s see the action on the Dow Jones Index chart.
We mainly look at the crossover between the CCI and the exponential moving average and at the time the crossover happens.
Ideally, we want a buy crossover above the 0 level and a sell crossover below the 0 level. But markets are not perfect, so we must adapt to current conditions.
The first signal occurred was a sell signal. The crossover was generated right on the 0-level and the price traded below the middle Bollinger Band. This was a valid short entry.
The second signal was a buy signal, but the crossover happened below the 0-level. Entering at this point is a riskier trade. A conservative buy opportunity would be to wait for the CCI to cross above the 0-level.
The third signal was a short opportunity. As the crossover occurred slightly above the 0 level, we waited for a few candles for the CCI to drop below the 0 level
The 4 signal was a no trade. The buy crossover happened below the 0 level and below the middle Bollinger Band. This is a high-risk trade and it’s better to avoid this kind of setups.
Bollinger Bands Trading Strategy for Swing Trading and Position Trading
If you prefer to focus on the bigger picture of the market then Bollinger Bands are also useful for swing trading and position trading.
The main selling point of the following strategy is taking positions only in the direction of the trend. The strategy involves two basic steps:
- Waiting for a pullback before entering the trade
- Entering the market when the traded instrument shows a sign that its price will continue in the direction of the prevailing trend.
The main goal is to profit from swings in price movement over the course of several days or weeks.
For determining the main trend we will use the Ichimoku indicator. We will only need the Kumo cloud, so we’ll plot only this indicator.
Ichimoku is one of the trading indicators that predict price movement and not only measures it. The advantage of the indicator is the fact that offers a unique perspective of support and resistance, representing these levels based on price action.
Here are the main guidelines that you should follow:
- We will use higher timeframes, H4 charts or Daily charts
- Plot the Bollinger bands with a 50-period moving average and a standard deviation of 3
- Add the Kumo cloud of the Ichimoku indicator
- We look to buy when the Kumo cloud is inside the middle Bollinger Band and the lower Bollinger Band
- We look to sell when the Kumo cloud is inside the middle Bollinger Band and the upper Bollinger Band
- Ideally, we want to ride the trend as much as possible, so we should use a trailing stop
- Stop loss placement is above or below the kumo cloud or the Bollinger bands
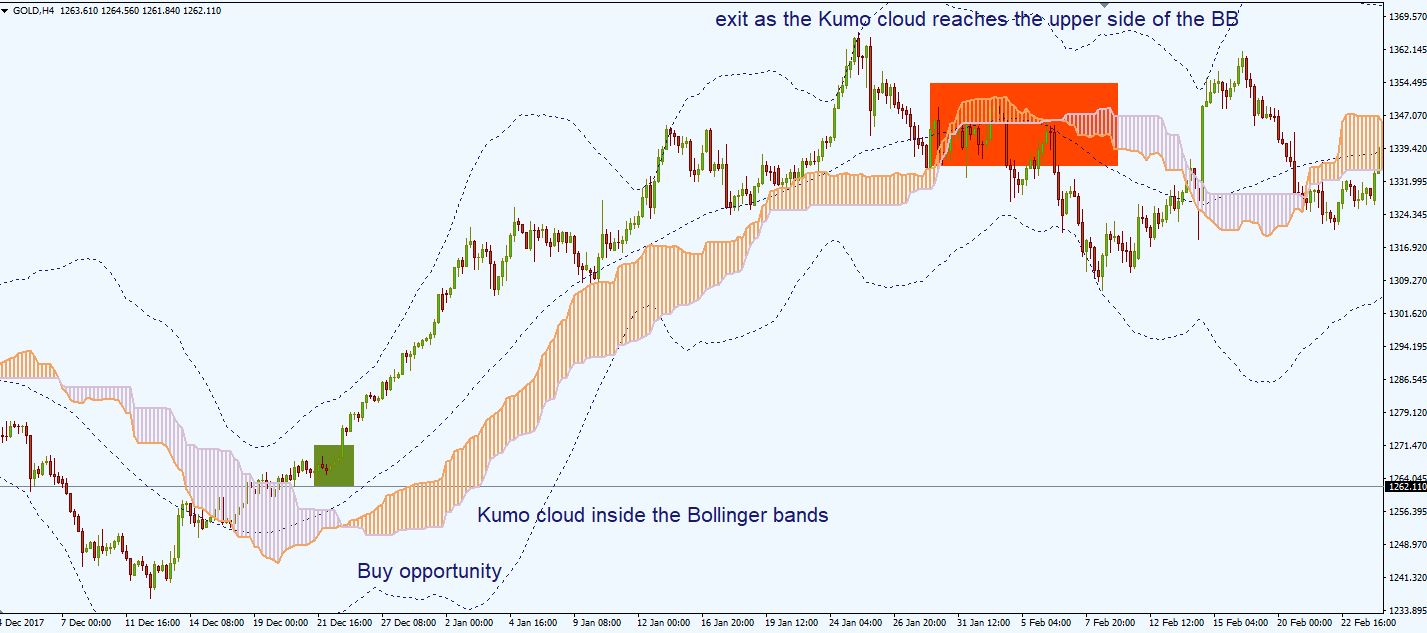
Let’s analyze a chart. We plotted the Gold chart, on the 4-hour timeframe.
We have the Kumo cloud inside the lower Bollinger Band and the middle Bollinger Band. This signals a strong trend and a good time to be long in the market.
Once we enter the trade, we place our stop-loss order below the Kumo cloud and we aim to catch a large portion of the trend.
We exit the market once the price hits our target or when the price closes below the Kumo cloud. Another exit is when the Kumo cloud enters the other side of the Bollinger Bands.
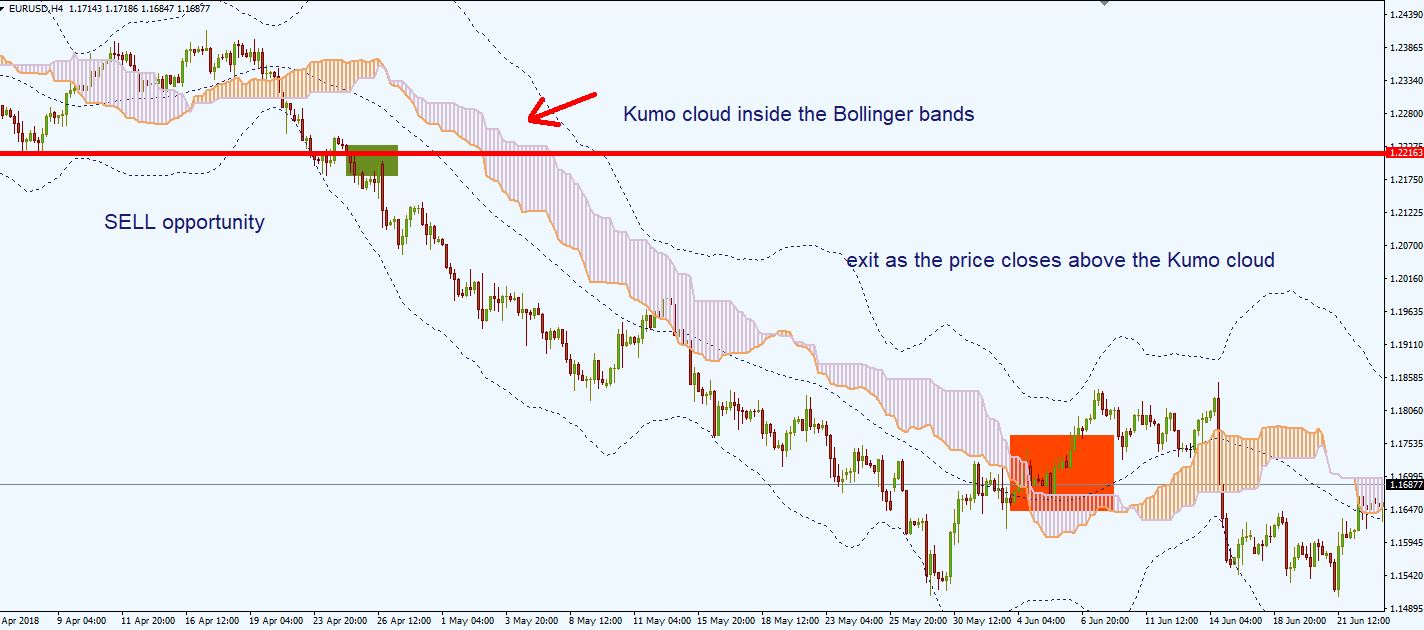
Look at the EUR/USD chart above. This time we have a selling opportunity.
Once we saw that the market broke below an important level of support, we immediately looked at the position of the Kumo cloud.
As the Kumo cloud was inside the Bollinger Bands, we decided to short the market. The stop-loss order was placed above the Kumo cloud.
And let the trade free, as long as the Kumo cloud stays inside the Bollinger Band, we are in an excellent position. You don’t need to close the trade otherwise. Let the trend do its thing.
You don’t want to settle for few pips. With this method you could catch a super trend.
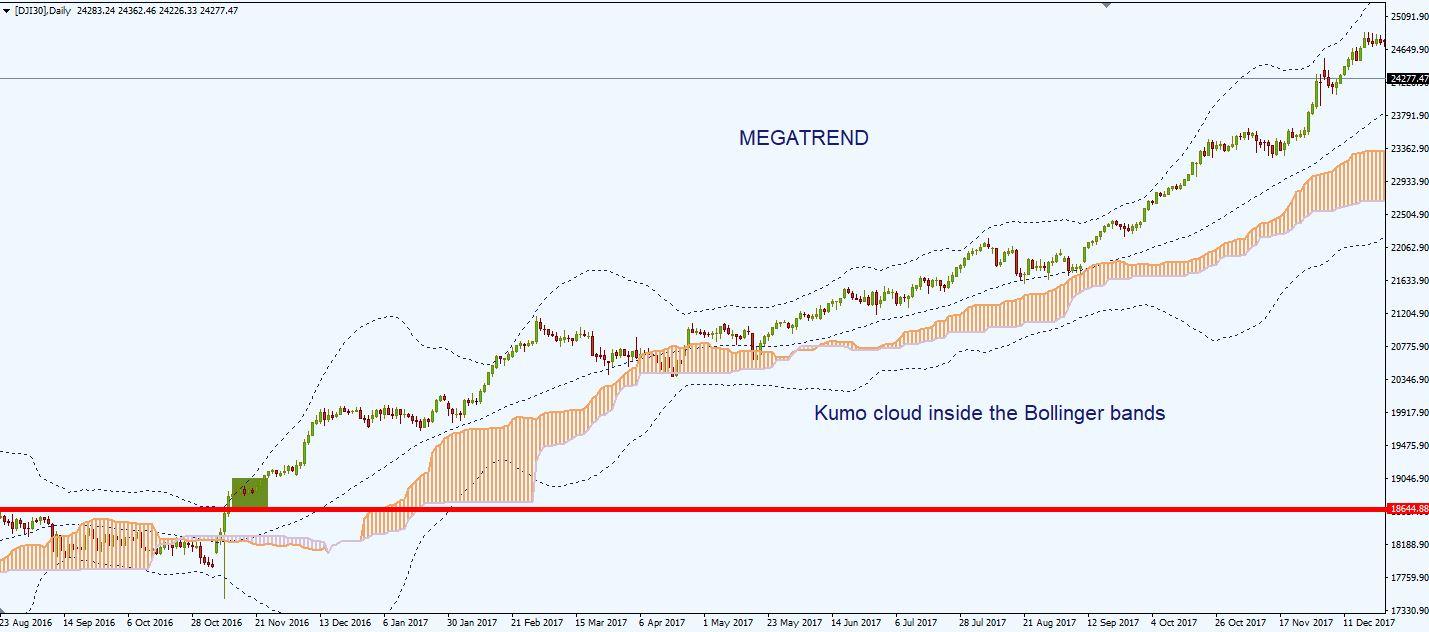
Look at this beauty. This is the Dow Index on the daily timeframe. Of course, these megatrends are rare, but with patience, discipline and luck we can catch such movements.
So, the trailing stop will be your friend in this system. Be greedy and try to catch the “big one”.
Bollinger Bands Indicator – Pros And Cons
- ↑ works well in non-trending market conditions
- ↑ good at measuring volatility
- ↑ useful at identifying overbought and oversold areas on the chart
- ↑ acts as a dynamic area of support and resistance
- ↓ good at identifying big movement on the market
- ↓ bad at identifying cycle turns, giving a lot of false signals
- ↓ lagging indicator, as it derives from a moving average and thus will react late to the price action
- ↓ does not contain all of the data necessary for proper analysis of price action, so it should be used in combination with other tools




1 thought on “Bollinger Bands Trading Strategy: Day Trading Tips”
What should be the expiry time in Bollinger bands Scalping strategy mentioned above? Can you give some details?