Table of Contents
What Is Average True Range (ATR)
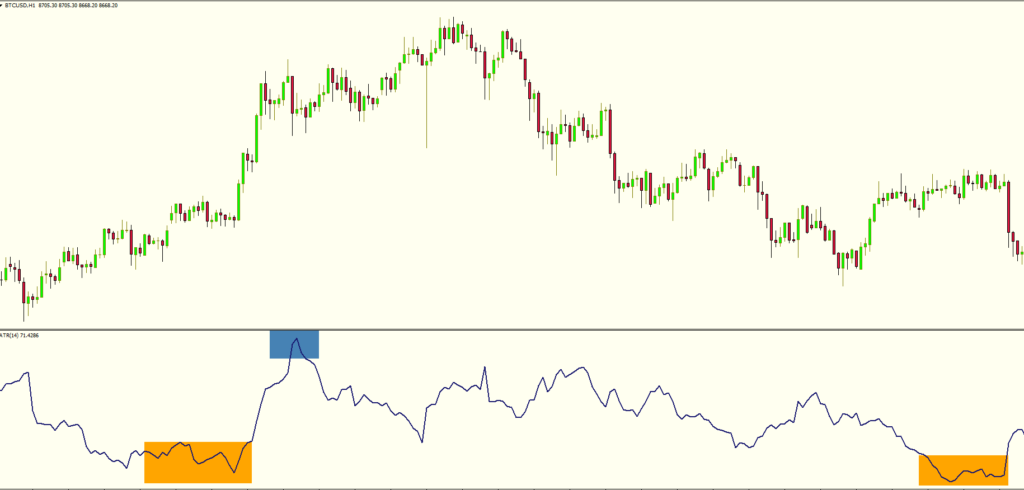
The average true range (ATR) indicator, developed by J. Welles Wilder, is a very useful tool in measuring volatility. The average true range measures the price range of a security/stock – the higher the volatility of a security the higher the ATR.
The average true range is one of the most useful technical indicators as it helps the trader deciding on where will set a stop loss or profit target, or if he even should open a trade in the first place. The Average True Range also includes gaps. Gaps are price points where there were no actual trades executed. Gaps often occur overnight or in reaction to news events. Gaps can occur within any time interval and without any event.
The ATR is measured as the greatest of any of the following 3 metrics:
- the value the current high minus the low;
- the distance of the current high minus the previous close;
- the distance of the current low minus the previous close
Finding the average range has a number of important implications and can help make better trading decisions.
Average True Rate Indicator Best Settings And Values
Despite the fact the Average True Range is not so common among traders, this indicator can assist them in entering and exiting trades. Also, the ATR is a useful tool for increasing profitability.
A security’s range is the difference between the highest price and lowest price on a given day. The Average True Range reveals information about how volatile a security is. High ranges reveal high volatility while small ranges suggest low volatility.
The average true range (ATR) is basically an exponential moving average of the true range. Most common settings of this indicator are the 14-day ATR. Depending on their trading objectives or the time frames, traders can use shorter or longer inputs of the ATR.
- longer ATR will be slower and will generate fewer trading signals
- shorter ATR will generate a higher number of trading signals and will increase trading activity
For example:
- An average true range of only 5 periods would not offer a large enough sample to generate an accurate indication of the true range of the security
- An average true range of 50 periods would generate a more smooth average true range on the chart, with fewer buy high-quality signals.
Let’s assume that we are using a swing trading strategy and we’re using an ATR with a 50-period input. You should keep in mind that if you’re trading on the daily chart, the ATR indicator will indicate the average volatility over the past 50 days.
However, if you’re trading on the H4 chart, the ATR indicator will display the average volatility over the past 50 H4 candles.
The ATR’s value differs from time frame to time frame, is not a unique value.
How To Read Average True Range Indicator
Range Indicator For Filtering Out Trades
The average true range is a good indicator for filtering out trades. If you prefer volatile markets or if your trading strategy is based on huge market moves, then ATR can filter out markets that are low in volatility. Even if you prefer calm, quiet markets the average true range indicator will help you to filter out those periods of times that you would prefer to avoid.
It is important to remember that the ATR does not measure the market direction. By tracking the average true range, a trader cannot identify the prevailing trend on the market. The ATR only tracks the magnitude of range, so it has limited use for generating accurate trading signals. It’s a useful indicator only for giving an idea about how much the price may move in a defined time frame.
ATR Formula For Profit Targets
Knowing the average range is extremely useful since it allows the trader to estimate how much profit potential there is in the market. For example, there is no point looking for 1000 points of profit from a trade in BTC/USD (bitcoin), if the average true range for that market over the last 14 days is only 300 points.
A wiser solution is to halve the 14-day ATR of bitcoin and use this figure as your profit target. Thus, after entering a trade in BTC/USD, set yourself a profit target of around 150 points.
Also, you know how important it is to set the stop-losses correctly. The Average True Range (ATR) helps the trader to set the value of a stop-loss that will protect him to exit the market too soon.
How To Trade With Average True Range | Signals And Trading Strategies
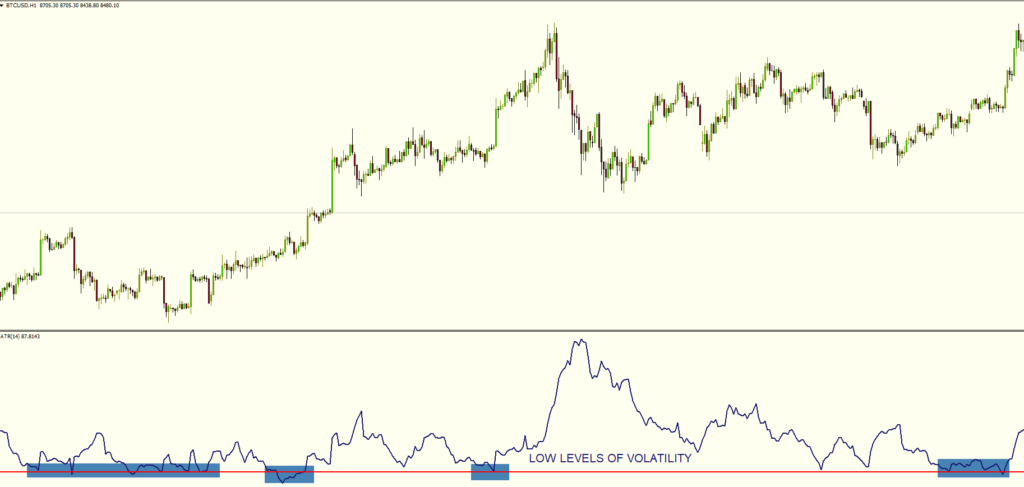
ATR Indicator To Identify Low Levels of Volatility
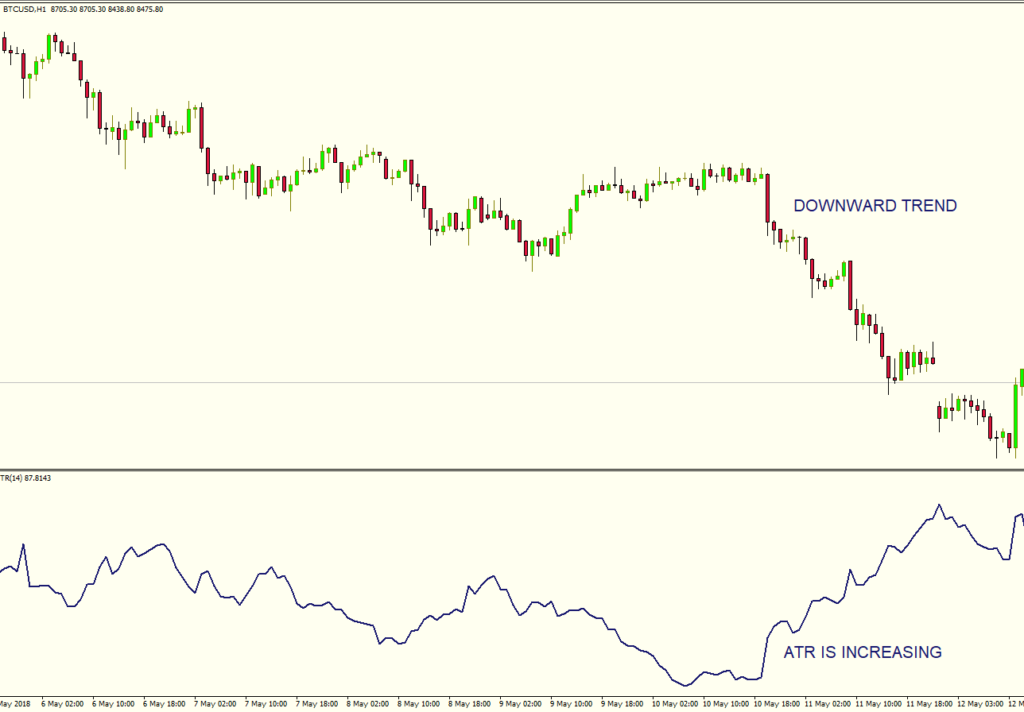
Average True Range doesn’t tell the trader anything about market direction. Don’t get confused about its direction. If the Average True Range is going up on the chart, that doesn’t mean that the trend is up.
A viable strategy would be to search for low volatility levels, in order to find a trade in the direction of the main trend.
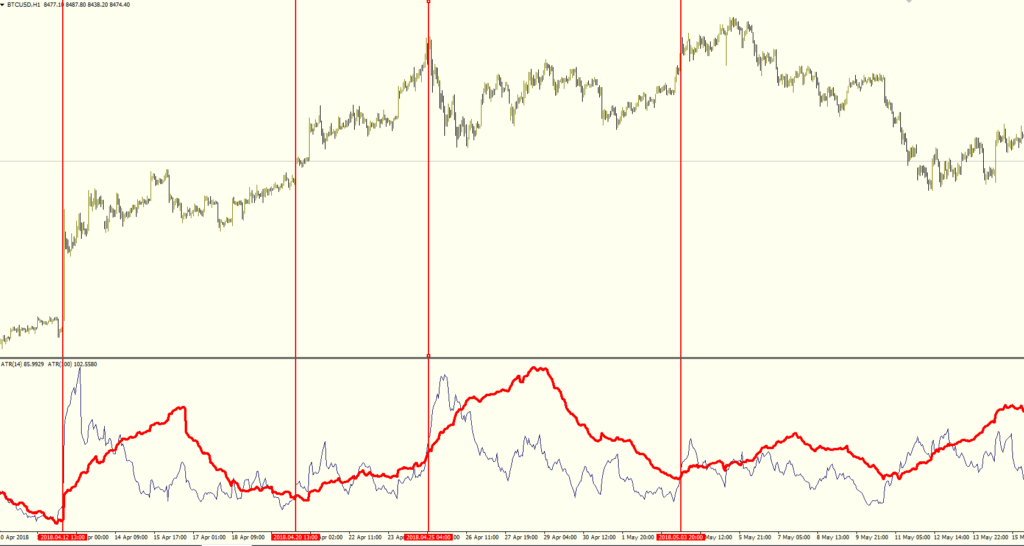
Let’s take a look at the Bitcoin graph below, we can see the ATR is quite high at 87. The first thing we need to do is to identify where the low volatility actually is. But that’s not enough, the low volatility itself is not enough for a new trend. This translates into the fact that the current trend has run out of steam, it doesn’t tell us that a new trend has begun. So, we must use the Average True Range in conjunction with other oscillators, like Stochastic, RSI, CCI, Pivot Points etc.
For example, in the chart above we identified low levels of volatility, but we cannot enter the market blindly. A smarter approach would be to wait for the average true range to exit from that level and confirm the volatility increase with a trend line breakout, or a rising Stochastic, or a divergence on the RSI or CCI, depending on your favorite indicators.
ATR Crossovers
Crossovers between 2 average daily ranges can also be used. For example, placing a trade when the fast ATR (14 period) crosses over a slower ATR (100 period). This can be an effective breakout volatility strategy, entering the market as it really starts to move. Of course, ATR crossover should not be used by itself and a trend indicator is necessary in order to filter bad trades.
ATR Trading Vs. Keltner Channel
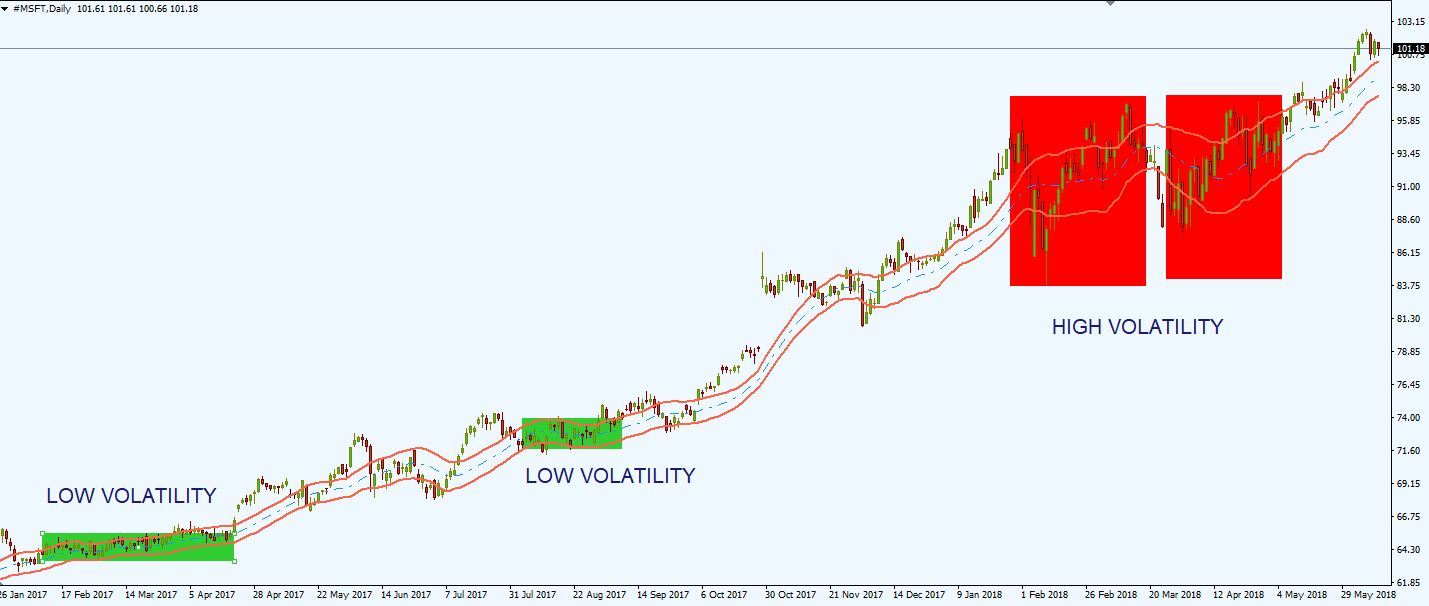
The Average True Range is included in the Keltner Channel indicator. Keltner Channel is a combination of an exponential moving average and the Average True Range indicator.
Keltner Channel uses the Average True Range to determine the channel distance. The channels are typically set two Average True Range values above and below the 20-period exponential moving average.
- Higher values of the Average True Range multiple will widen the channel. This will result in fewer, but better quality signals. A wide Keltner Channel suggests increased volatility.
- Smaller values of the Average True Range multiple will narrow the channel. This will result in more market noise. A narrow Keltner Channel suggests lower volatility.
What is the Average Daily Range
The Average Daily Range (ADR) is an indicator which offers traders information on the daily volatility. The Average Daily Range shows the average range of an instrument measured over a certain number of periods.
How to Calculate the Average Daily Range In Forex Market
The daily range of an instrument is calculated by measuring the distance between the daily high and daily low of an instrument. The average daily range will be plotted as a number on your screen.
Daily Range = Daily High – Daily Low
Let’s assume that we want to calculate the average true range of the EUR/USD currency pair in the last 3 days.
The daily ranges of the currency in the last 3 day were:
Day 1 = 100 points
Day 2 = 75 points
Day 3 = 30 points
Average Daily Range = (Day 1+ Day 1+ Day 3) / 3
Average Daily Range = (100+ 75+ 30) / 3 = 68.3
The average daily range for the EUR/USD currency in the last 3 days was around 68 points.
So, what does this 68 number mean?
Well, this number represents the number of points you expect the EUR/USD to fluctuate during a trading day.
The Average True Range doesn’t indicate market direction. It doesn’t tell traders that EUR/USD will move up 68 points or will decrease by 68 points. It just indicates that the distance between the high of the day and the low of the day could be around 68 points.
How to Read the Average Daily Range
Volatility
The most important role of the Average Daily Range is to estimate the volatility of an instrument.
- If a stock/security/currency has a high Average Daily Range during a specified period, this means that the instrument is volatile
- If a stock/security/currency has a low Average Daily Range during a specified period, this means that the volatility of the instrument is low
Risk
The Average Daily Range measures the market risk that a trader is willing to take when entering a trade.
If the price fluctuated widely in the analyzed period, the instrument is considered more volatile and also riskier. Now, depending on the risk aversion of an investor, a volatile instrument could be an attractive opportunity or a very bad one.
Usually, investors seek volatility, as in can bring explosive profits in a short time if the market timing is done correctly.
So, a higher Average Daily Range comes with a higher market risk.
Early Warning
The Average Daily Range could offer an early signal whether the market is about to reverse, or at least stop its current momentum.
When an instrument recorded during the day a high Average Daily Range, but the trading session isn’t over, this could be an early warning that the momentum might stop.
Of course, the price could continue in its direction even more, but it’s safer to know the markets’ limits.
This information is mainly useful for day traders. If you are a swing trader or position traders, this warning would not matter to you. That’s because you already know that you will hold your market position for days or weeks.
Stop-Loss and Take-Profit Levels
The Average Daily Range can also offer traders accurate price targets for determining their stop-loss orders and take-profit levels.
Usually, traders place their stop-loss orders below the ADR if they are long on the market and above the ADR if they are shorting the market.
Also, if the price market is near the Average Daily Range, the traders may opt to lower their profit levels, or set them around the Average Daily Range level.
The Strength of a Trend
The Average Daily Range is also useful in determining the strength of a trend. Upward or downward movements with an Average Daily Range above average suggest a strong trend.
I prefer to analyze separately the days with a high Average Daily Range, in order to spot some patterns.
Breakouts
The Average Daily Range is also useful for identifying breakouts from a ranging market, where the prices are trading sideways. Market breakouts or market reversals are usually followed by an increase in Average Daily Range.
Difference between Average True Range and Average Daily Range In Forex Market
The Average True Range is basically an extended version of the Average Daily Range.
While Average Daily Range measures the average of the range of an instrument, the Average True Range shows the average of the true range the instrument.
The main difference between the two indicators is the fact that the Average True Range also includes gaps. What is so important about gaps? Well, by using the Average True Range we can incorporate the volatility determined by a gap.
On the Forex market, this extra volatility might not be very useful because huge gaps are not so common. That why many traders prefer to use the Average Daily Range.
However, if you are trading stocks or placing trades on the commodity market, gaps occur often. In this case, it’s advisable to use the Average True Range.
In conclusion, we could say that the Average True Range incorporates the Average Daily Range. That’s why the ATR will always be equal or greater than the Average Daily Range.
Average True Range Pros And Cons
- ↑ works well in trending market conditions
- ↑ good at identifying cycle turns
- ↑ excellent at identifying volatility
- ↑ good at filtering trades
- ↓ doesn’t factor direction of the price
- ↓ does not contain all of the data necessary for proper analysis of price action, so it should be used in combination with other oscillators

