Table of Contents
What Is Ichimoku
An Ichimoku chart, developed by Goichi Hosoda, represents a trend-following system with an indicator similar to moving averages. Ichimoku is one of the trading indicators that predicts price movement and not only measures it. The advantage of the indicator is the fact that offers a unique perspective of support and resistance, representing these levels based on price action.
How To Calculate Ichimoku Indicators (Settings)
An Ichimoku chart includes several indicators:
• Tenkan-sen – plotted as the highest high + lowest low/2, averaged over the last nine periods;
• Kijun-sen – plotted as highest high + lowest low/2, averaged over the last 26 periods;
• Senkou Span A – (Tenkan-sen + Kijun-sen)/2, plotted 26 periods ahead;
• Senkou Span B – plotted as the highest high + lowest low/2, averaged over the last 52 periods and plotted 26 periods ahead;
• Chikou span – plots the current closing price, 26 periods back;
• Kumo – the cloud occupying the space between Senkou Span A and Senkou Span B.
Tenken-Sen Line Indicator
Short-term trend line also known as the turning line. Tenken-Sen signals an area of minor support or resistance.
Kinjun-Sen Line Indicator
Is also known as the confirmation line and serves as a signal for support and resistance levels. Some traders use Kinjun-Sen Line as a trailing stop level.
Senkou Span A Indicator
This line serves as a signal for support and resistance levels. If the price is trading above the line, then Senkou Span A will serve as a major support level. If the price is trading below Senkou Span A it will serve as a level of major resistance.
Senkou Span B Indicator
This line serves as a second level of support or resistance. If the price is trading above the line, then Senkou Span B will serve as a major support level. If price is trading below Senkou Span B it will serve as a level of major resistance.
Kumo Cloud Indicator
An area located between the Senkou Span A and Senkou Span B lines, also known as the cloud.
Chinkou Span Line Indicator
This line is also known as the lagging line, used as confirmation of signals. Chinkou Span Line can also serve as a support and resistance level.
How To Read Ichimoku Indicators
For most traders, Ichimoku might seem complicated, but once you get familiar with how to interpret the charts you’ll spot great trading signals.
Ichimoku is interpreted as follows:
• Tenkan-sen measures short-term price movement – also known as the turning line and represents a signal of an area of minor support or resistance
• if the market price is above the Tenkan-sen, this suggests a short-term upward momentum
• if the price is below Tenkan-sen, this suggests a short-term downward momentum
• an increasing Tenkan-sen indicates an upward trend
• a decreasing Tenkan-sen indicates a downward trend
• Kijun-sen represents medium-term price movement – also known as the confirmation line
• If the market price is above the Kijun-sen, this suggests a medium-term upward momentum
• If the price is below Kijun-sen, this suggests a medium-term downward momentum
• an increasing Kijun-sen indicates an upward trend
• a decreasing Kijun-sen indicates a downward trend
• Chikou span indicates the big-picture of the trend (the evolution of the current price action in relation to previous price action)
• when Chikou span is above the current price, this indicates that current prices are higher than previously, and suggest a bullish bias
• when Chikou span is below the current price, this indicates that current prices are lower than previously, and suggest a bearish bias
• when Chikou span is near the current price, this indicates a trading range
• Kumo, plotted as a cloud, indicates dynamic support and resistance, based upon price action.
• the longer the price stays below/above the Kumo cloud, the stronger the trend is
• when the cloud is wide, the expected support or resistance is strong.
• when the cloud is thin, the expected support/resistance is thin.
• you should never trade inside the Kumo cloud
How To Trade With Ichimoku – Signals And Trading Strategies
Tenkan-sen Kijun-sen – Chikou Span Filter Crossover Trading Strategy
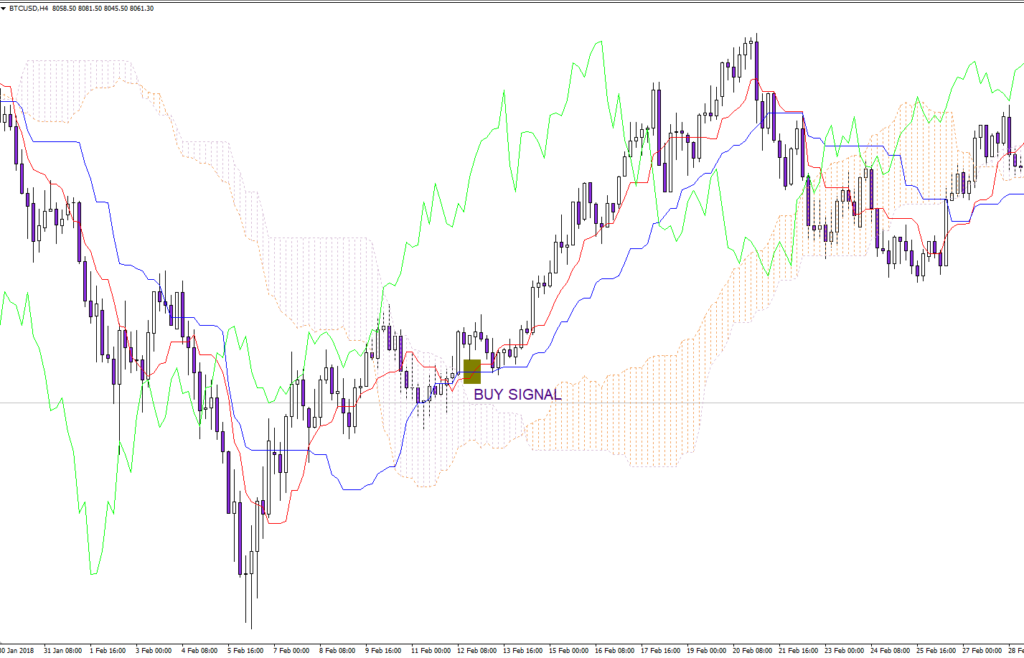
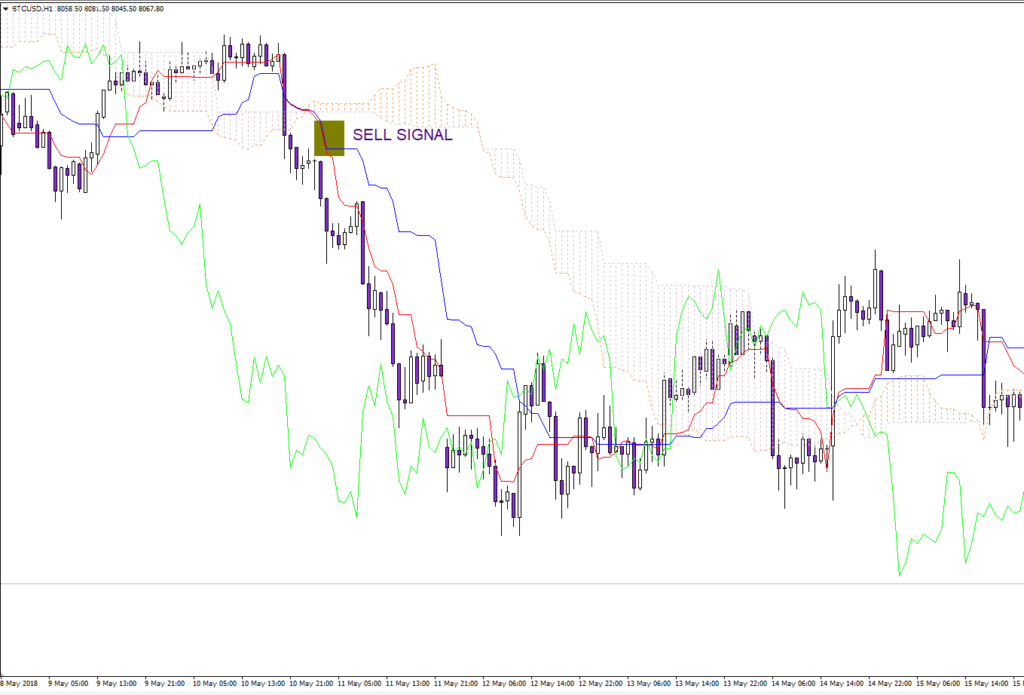
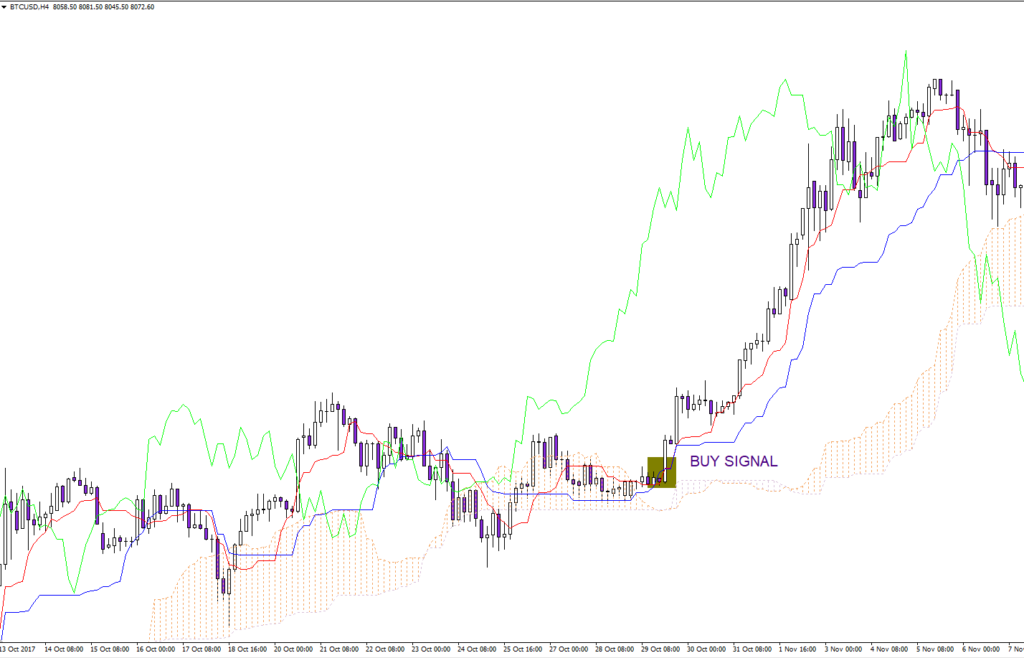
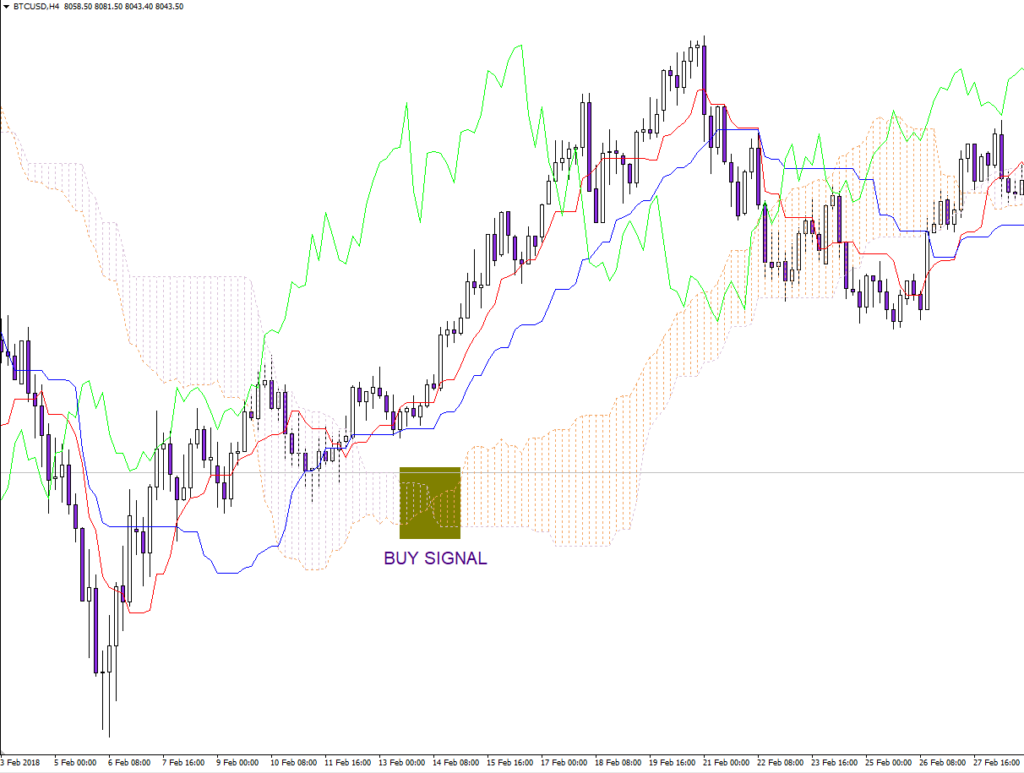
The crossover between Tenkan-sen and Kijun-sen lines can offer trading opportunities, in a similar fashion to a moving average crossover.
• when fast-moving Tenkan-sen crosses above the slower-moving Kijun-sen, we have a buy signal
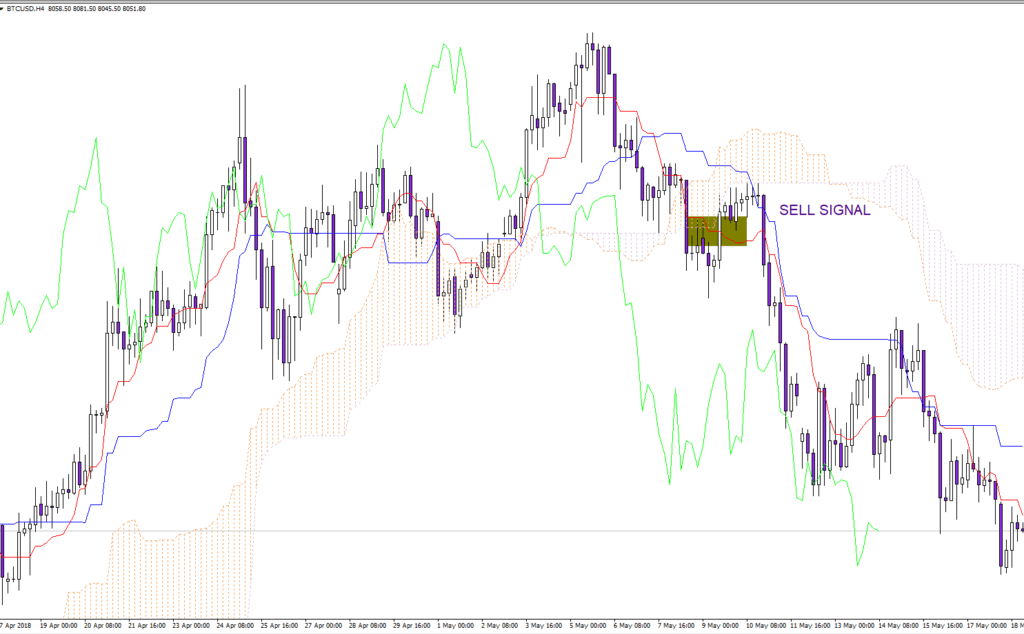
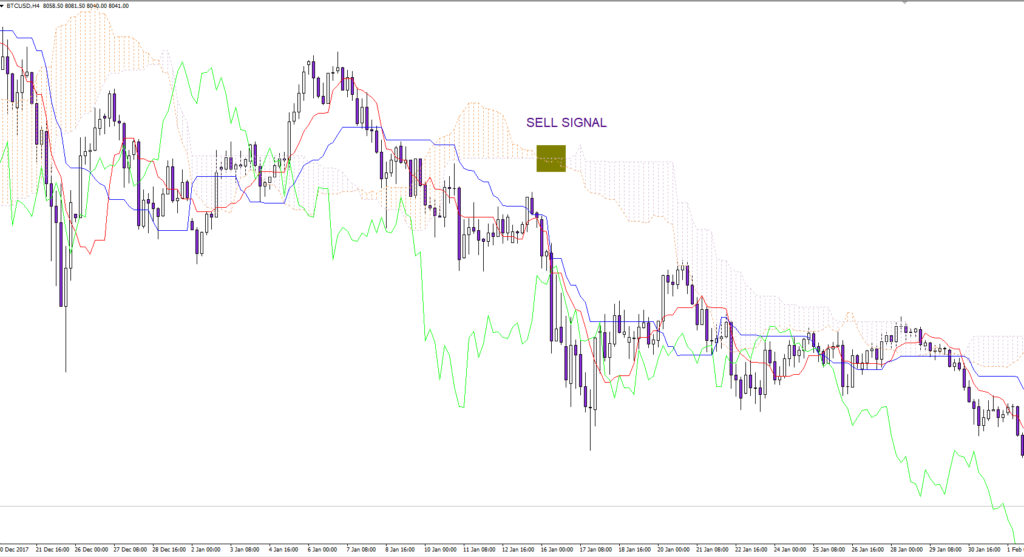
• when fast-moving Tenkan-sen crosses below the slower-moving Kijun-sen, we have a sell signal
We could filter the signals received with the Chikou span, for safer entries. Thus, we could only take positions that are in line with the overall trend.
• if Tenkan-sen crosses above Kijun-sen, you would only buy if the Chikou span indicates a bullish bias.
• if Tenkan-sen crosses below Kijun-sen, you would only sell if the Chikou span indicates a bearish bias.
Tenkan-sen Kijun-sen Crossover Trading Strategy (Kumo Cloud filter)
Another filtering technique takes the Ichimoku Kumo cloud into consideration.
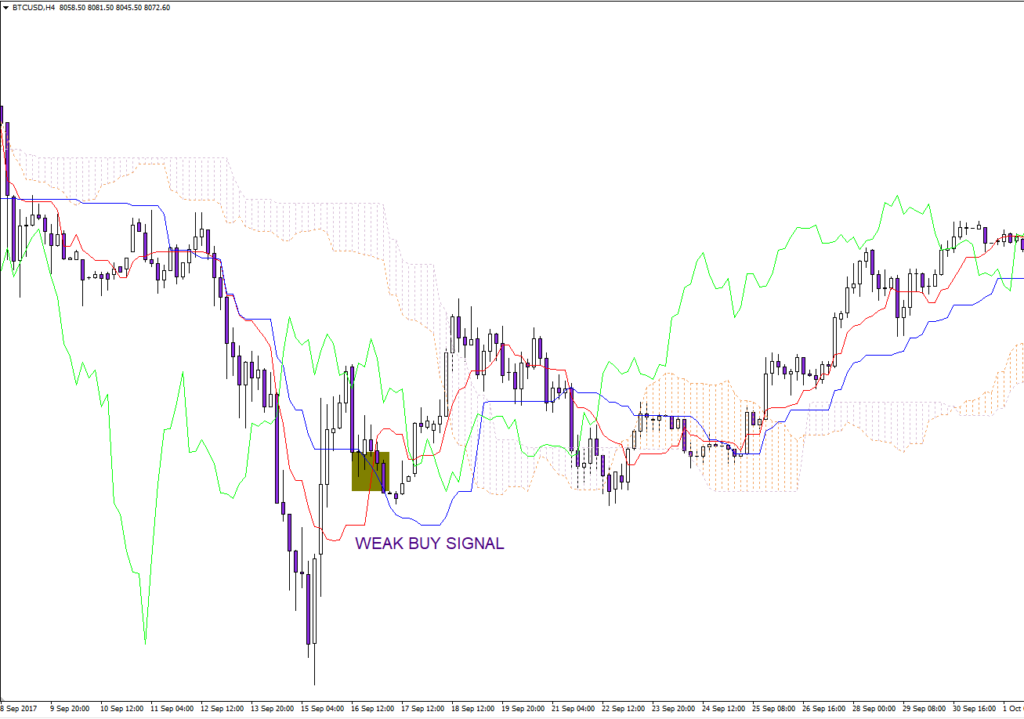
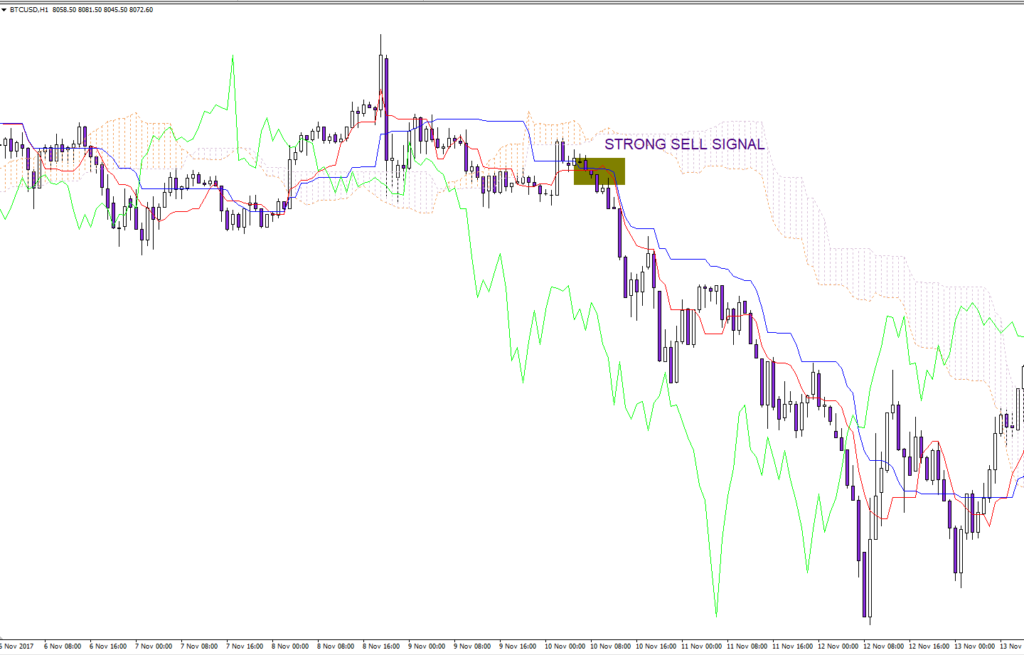
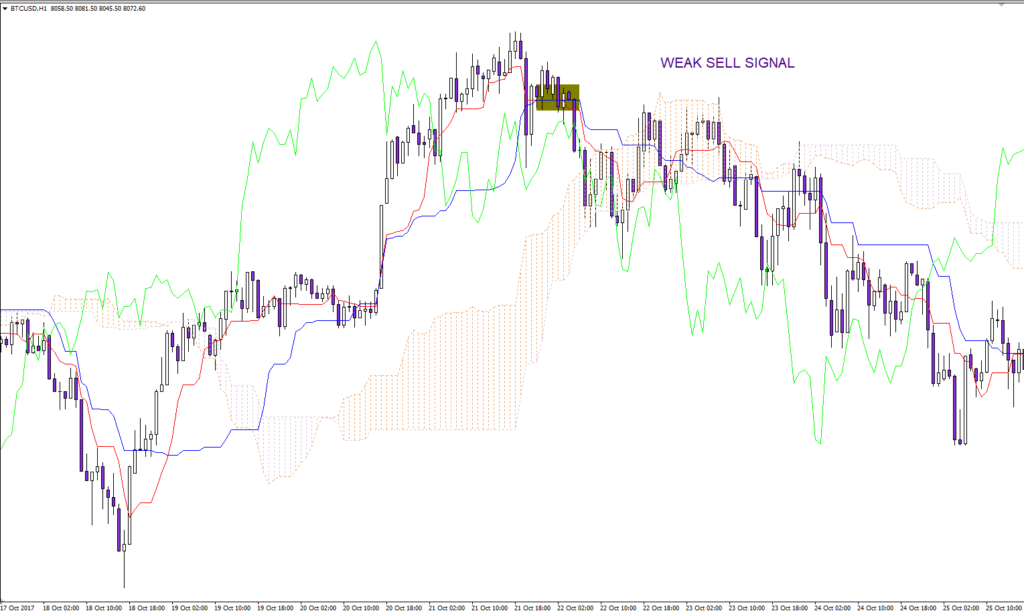
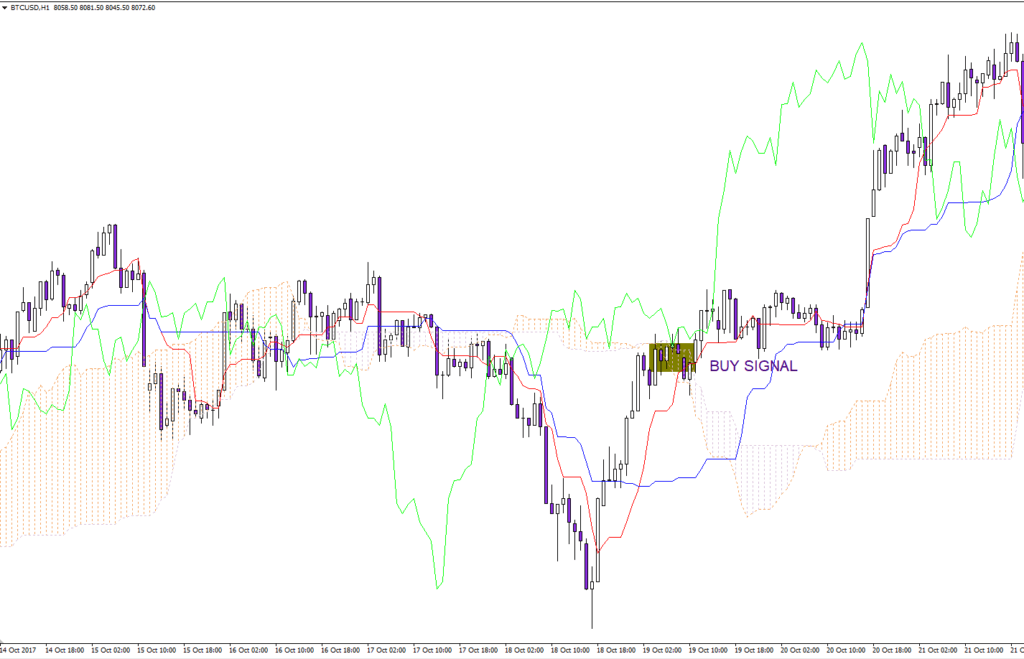
• when fast-moving Tenkan-sen crosses above the slower-moving Kijun-sen, above the Kumo cloud, we have a strong buy signal
• when fast-moving Tenkan-sen crosses above the slower-moving Kijun-sen, below the Kumo cloud, we have a weak buy signal
• when fast-moving Tenkan-sen crosses below the slower-moving Kijun-sen, below the Kumo cloud, we have a strong sell signal
• when fast-moving Tenkan-sen crosses below the slower-moving Kijun-sen, above the Kumo cloud, we have a weak sell signal
KUMO Cloud Breakout Trading Strategy
This signal occurs when the price cuts through the Kumo cloud.
• when the price enters the Kumo cloud and breaks its upper wall upward, we have a bullish signal
• when the price enters the Kumo and breaks its lower wall downward, we have a bearish signal
Senkou Span Crossover Trading Strategy
The crossover between Senkou span lines is another trading strategy used by traders, in a similar fashion to a moving average crossover. However, we must take into consideration that the Senkou lines are projected forward by 26 periods.
• When Senkou Span A cuts the Senkou Span B from the below to the upside, and prices are positioned above the Kumo, we have a strong buy signal
• When Senkou Span A cuts the Senkou Span B from the upside to the bottom, and prices are positioned below the Kumo, we have a strong sell signal
• When Senkou Span A cuts the Senkou Span B from the bottom to the upside, and prices are positioned below the Kumo, we have a weak buy signal
• When Senkou Span A cuts the Senkou Span B from the upside to the bottom, and prices are positioned above the Kumo, we have a weak sell signal
Ichimoku Trading – Pros And Cons
• ↑ Leading indicator that predicts price movements
• ↑ Excellent at offering dynamic support and resistance levels
• ↑ Good at measuring the direction and intensity of the current market trend
• ↓ During non-trending markets will offer a lot of false signals


3 thoughts on “Ichimoku Trading Strategy: Cloud Trading Explained”
subscribe to the pro I just have a question I scalp u.s. stock market do I need to change the formula or do anything to the renko charts since it’s only for the one minute 3 minute and 5 minute charts
what time frame can we use
Theo tôi là tất cả các khung thời gian. Và luôn phải để ý mây tương lai. Khi chiku vượt qua đường giá+đường giá đã trên kumo cũng không có nghĩa đã là tín hiệu tăng mạnh nếu mây tương là mây phẳng.