Table of Contents
What Is Parabolic SAR
Parabolic SAR, developed by Welles Wilder, is an indicator mainly used to identify the market direction and the beginning of reversals.
Parabolic SAR allows traders to evaluate the trend direction, to pinpoint entry and exit points and also placing trailing stops. The indicator is displayed as a series of dots.
How To Read Parabolic SAR Indicator
Unlike other trend-following indicators, Parabolic SAR formula can spot short-term price changes.
- When the price is trading below the Parabolic SAR, this can be interpreted as a signal to sell or remain short
- On the other hand, if the price is trading above the Parabolic SAR, this can be interpreted as a signal to buy or remain long.
Parabolic SAR Formula: Best Settings
The calculation of the Parabolic SAR indicator is rather complex. The indicator comes with 2 parameters which can be adjusted depending on trader’s preference.
‘Step” and “Maximum Step” are the parameters offered by the PSAR and they determine how sensitive the indicator is to changes in price movements. The default settings for the SAR parameters are 0.02 for the step and 0.2 for the maximum step.
- By increasing the values of Step and Maximum Step, the traders can increase the sensitivity of the indicator, at the same time sacrificing its precision, as the indicator will offer many false signals
- By lowering the values of Step and Maximum Step, the Parabolic SAR will become less sensitive but will also provide more accurate signals.
It’s important to find a balance between these parameters, in order to generate quality signals which are not lagging the price.
Parabolic SAR is a lagging indicator, as it follows the price. A trader will need the help of other oscillators to generate quality signals.
This indicator is profitable for day traders since it dynamically shows the direction of a trend. For long-term traders, the PSAR may not be very useful, as many traders adjust their stops based on relevant market lows and highs.
How To Trade With Parabolic SAR – Signals And Trading Strategies
1. SAR Reading: Parabolic Stop And Reverse
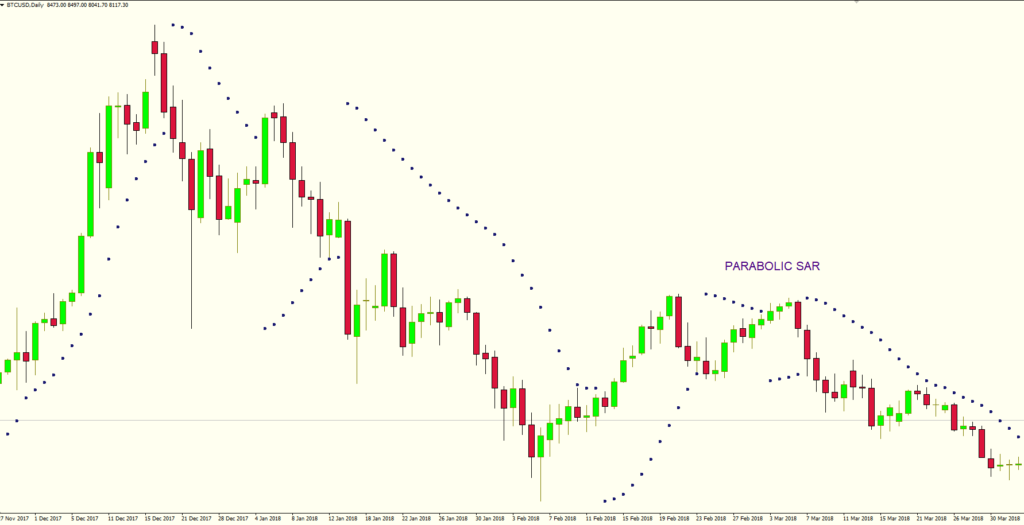
Parabolic SAR indicator provides great signals that the market trend is about to change. Below is the visual interpretation of the PSAR:
- A dot appears below the price when the trend is upward (SAR buy signal), while a dot is placed above the price when the trend is downward (SAR sell signal).
- Parabolic SAR trails the price until the trend has finished and begins to reverse (parabolic stop and reverse).
- As the trend comes to an end, Parabolic SAR moves closer to the price and ends up touching the price
- Parabolic SAR then forms on the other side of the price, signaling a change in direction
The Parabolic SAR provides excellent exit points, as it provides a stop loss level that moves closer to the price, regardless of the market direction. The rule is that you should close buy positions when the price moves below the SAR and close sell positions when the price moves above the SAR.
The Parabolic SAR works best in trending markets, helping the trader to ride trend waves for a good period of time and capture substantial profits.
However, in ranging markets the Parabolic SAR will generate a lot of false trading signals, as will whipsaw back and forth.
2. Parabolic SAR Trading Strategy: Volatility SAR Trade
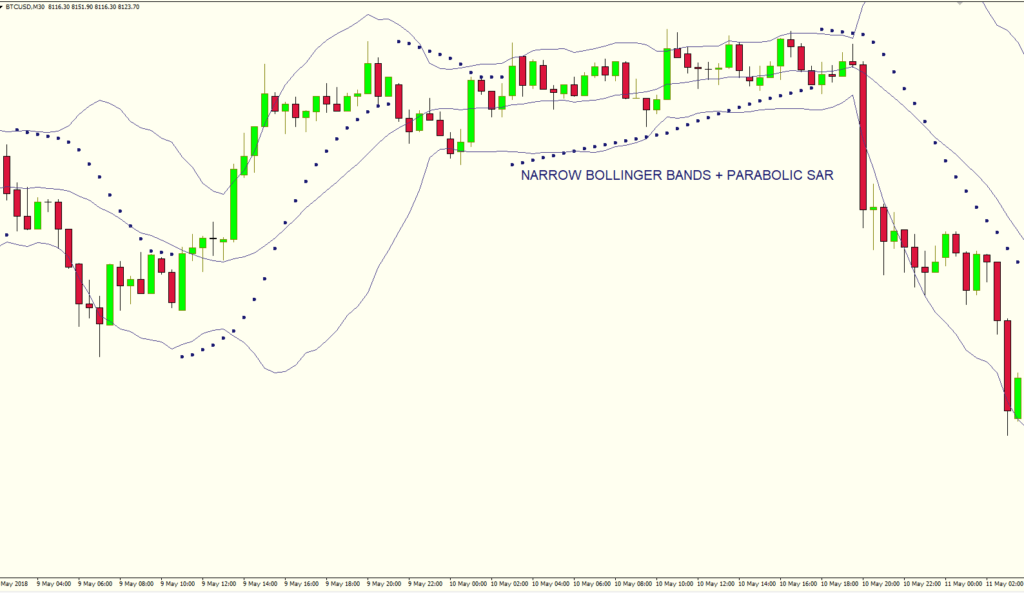
PSAR is also well suited during periods of volatility, when market trends are more relevant, along with other indicators measuring volatility, like the Bollinger Bands. The Parabolic SAR can also be combined with other indicators designed to determine the strength of a trend, like ADX. Also, parabolic SAR in combination with moving averages as a trend following trading strategy is an effective method to lock profits.
If we analyze the Bitcoin chart above, we can observe the power of the PSAR in combination with Bollinger Bands. The expanding Bollinger bands in combination with the signals offered by PSAR offered a great opportunity to short the market, and at the same time, to place the stop-losses at safe levels.
Parabolic SAR – Pros And Cons
- ↑ works excellent in trending market conditions, on Forex and stocks
- ↑ good at identifying cycle turns
- ↑ excellent at placing a trailing stop
- ↓ offers a lot of false signals when traded on the shorter timeframes
- ↓ during ranges, or consolidation phases can produce a lot of whipsaws
- ↓ does not contain all of the data necessary for proper analysis of price action, so it should be used in combination with other indicators measuring the strength of the market


