Table of Contents
If an investor understands the concept of stocks volatility, he already is one step ahead of most market participants. The volatility measures the rate at which a stock moves. A volatile stock is one that records rapid fluctuations in price. A non-volatile or stable stock registers moderate price fluctuations.
The Importance of Market Volatility
- The most important role of the market volatility is to estimate the value of market risk. In other words, the volatility measures the market risk that an investor is willing to take when investing in a certain stock.
- Market volatility can offer an early signal whether the market is about to reverse
- Market volatility is also an important parameter for pricing financial derivatives, as many option-pricing techniques include a volatility parameter for the evaluation of the price of a stock.
- Market volatility is also used for risk management applications. Financial institutions must know at all times the current value of the volatility of the managed assets, but also must estimate the future volatility.
- Market volatility also measures the strength of a stock trend. Strong upward trends are usually characterized by a decrease in volatility while strong downward trends are generally marked by an increase in volatility.
- Volatility forecasting is very important for institutions involved in options trading and portfolio management.
- Volatility is also useful for identifying breakouts from a ranging market, where the prices are trading sideways. Market breakouts or market reversals are usually followed by an increase in volatility.
Types of Volatility
Investors mainly use two types of volatility in their stock analysis: historical volatility and implied volatility.
Historical Volatility
Historical volatility, also known as statistical volatility, measures the price fluctuations of a stock over a specified period. In other words, historical volatility predicts how far a stock might move in the future considering how fast it has been moving in the recent period. Thus, the historical volatility is a lagging indicator.
Historical volatility is based on the price fluctuations of the stock from one day’s close to the next close, and so intraday high swings and low swings are not included in its calculation.
If a stock price fluctuated widely in the analyzed period, it is considered more volatile and also riskier. Now, depending on the risk aversion of an investor, a volatile stock could be an attractive opportunity or a very bad one. Usually, investors avoid volatile stocks, despite the fact that can bring explosive profits in a short time if the market timing was done correctly.
In general:
- Stocks with a historical volatility below 10% have very low volatility.
- Stocks with a historical volatility between 10 % – 30% are considered moderately volatile.
- Values around 30%-60% in historical volatility characterize volatile stocks.
- Values above 70% in historical volatility characterize very volatile stocks.
Most volatile stocks
- Growth Stocks
Growth stocks are stocks that are being valued on their potential, rather than actual intrinsic value. Investors usually bet that these companies will grow faster than the competition, usually as a result of a great product/service or due to their capable management.
Growth stocks typically reinvest all the profits they make for increasing the business. This means that investors buy growth stocks because they anticipate the value of the stock to increase as opposed to buying the stock for receiving a dividend.
Growth stocks are extremely volatile; they can make huge price moves in either direction.
- Penny Stocks
Penny stocks are stocks that are usually traded for less than a dollar per share (some people define a penny stock as one selling for less than 5 USD per share).
These stocks offer investors their potential. Penny stock investors are buying the stock at very low prices hoping for a home-run. Penny stock prices are extremely volatile and their trading volume is very low. With such low-volume, it’s easy for dodgy investors to manipulate the price.
Implied Volatility
Implied volatility measures the market perception of how volatile a stock is likely to be in the future. The main difference between historical and implied volatility is that the historical volatility is calculated on the past price movements of the stock, while implied volatility is based on the current market price for the options for that stock.
In other words, the historical volatility is a reflection of what has already happened, while implied volatility reflects the market’s current expectations for the future volatility of a stock.
The implied volatility is more important for options traders than for the average investor. Why? Because it reveals how volatile the market might be in the future and helps traders calculate the probability. Implied volatility is a very important parameter of options trading used in determining the probability of a stock reaching a specific price by a certain time.
Also, keep in mind that implied volatility shows the market opinion of the potential price fluctuation of a stock, but it doesn’t forecast its direction.
- A high implied volatility suggests that the market believes the stock has the potential for large price swings in either direction, upward or downward
- A low implied volatility suggests that the market believes the stock will not move as much by options expiration.
Indicators measuring stocks volatility
We left aside the calculation of historical and implied volatility, as this process is rather complex and complicated. Instead, let’s focus on the technical indicators that assist traders and investors in determining stocks volatility.
There are several useful indicators that measure the volatility of a stock.
Average True Range (ATR)
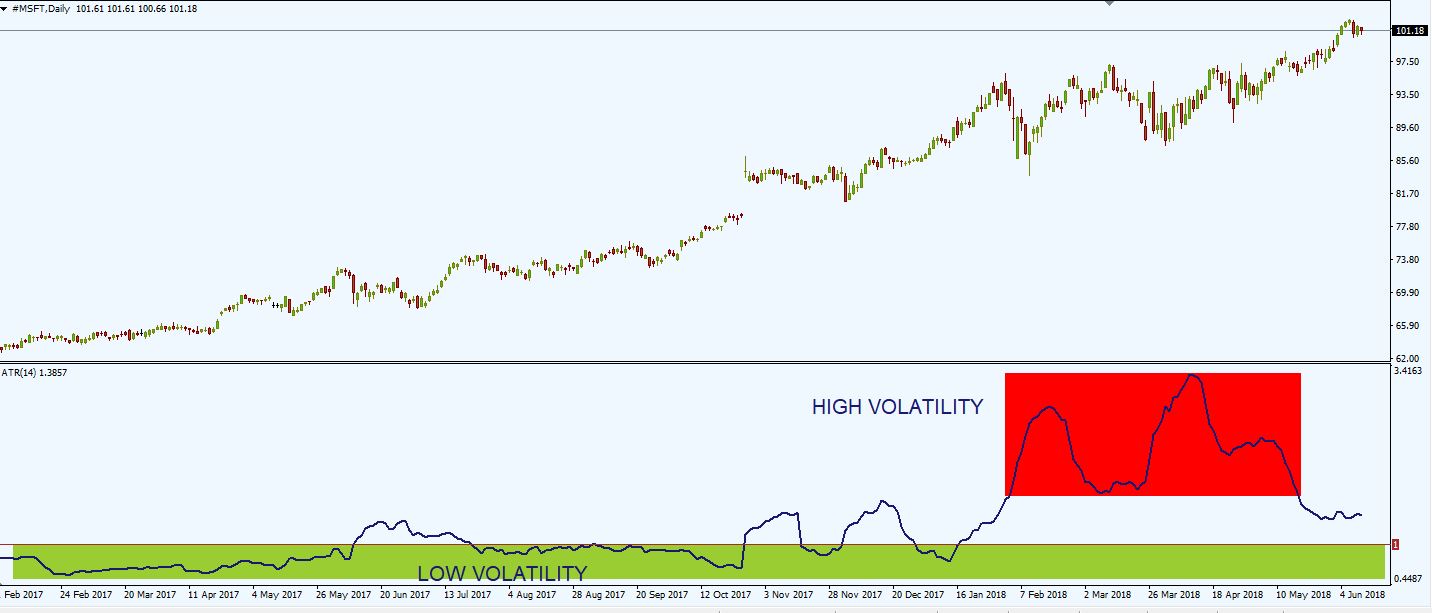
The average true range (ATR) indicator is a very useful tool in measuring stocks volatility. The average true range measures the price range of a stock – the higher the volatility of a security the higher the ATR.
The ATR is measured as the greatest of any of the following 3 metrics:
- the value the current high minus the low of the stock;
- the distance of the current high minus the previous close of the stock;
- the distance of the current low minus the previous close of the stock
The average true range is a good indicator for filtering out trades. If you prefer volatile stocks or your trading strategy is based on huge market moves, then ATR can filter out stocks that are low in volatility. Even if you prefer calm, quiet stocks the average true range indicator will help you to filter out those periods of times that you would prefer to avoid.
It is important to remember that the ATR does not measure the market direction of a stock. By tracking the average true range, a trader cannot identify the prevailing trend on the stock. The ATR only tracks the magnitude of range, so it has limited use for generating accurate trading signals. It’s a useful indicator only for giving an idea of how much the price may move in a defined time frame.
Knowing the average range is extremely useful since it allows the investor to estimate how much profit potential there is in the stock.
Bollinger Bands
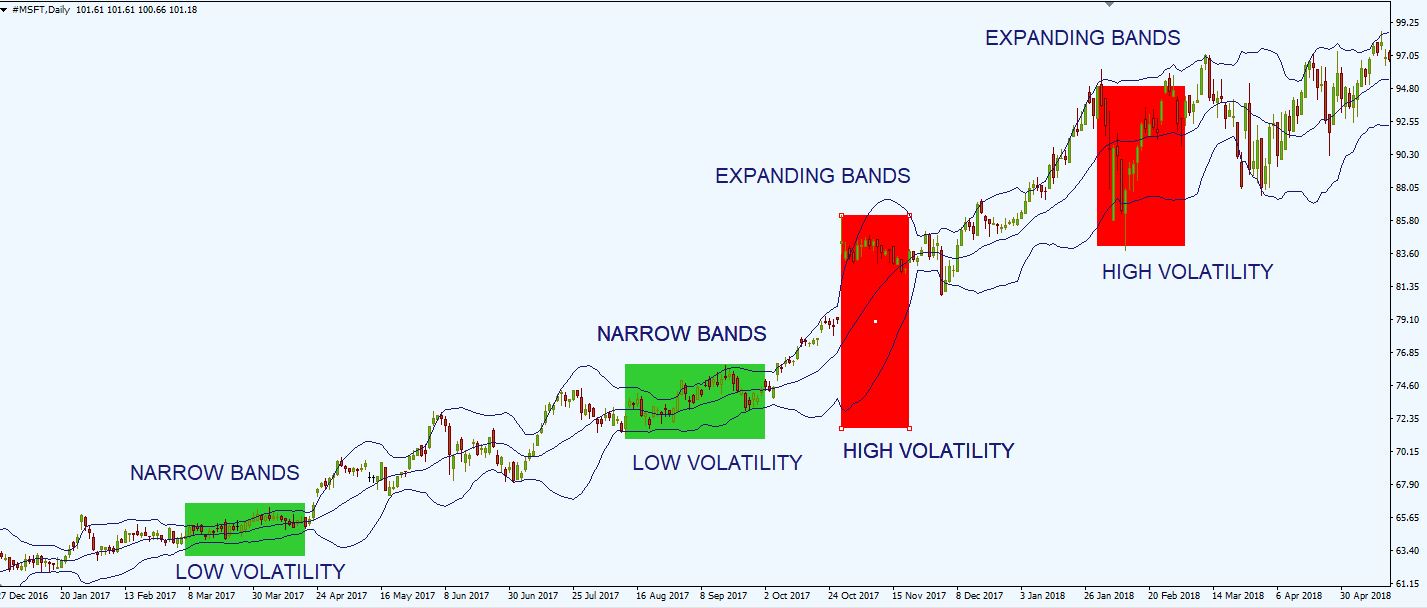
Bollinger Bands are a trend indicator that detects the volatility and dynamics of the price on the market. The bands contract when the stock volatility is low and expand when volatility increases.
- During periods of low volatility, Bollinger Bands are narrow
- During periods of high volatility, Bollinger Bands expand drastically.
Bollinger Bands consists of 3 parts (all lines):
- The middle band, representing a simple moving average (most common value is 20)
- The upper band, which is the period + N standard deviations (usually 20 + 2 STD)
- The lower band, which is the period – N standard deviations (usually 20 – 2 STD).
The wider the bands, the more volatility the stock has. A narrow band means indecision on price movement and when this happens, it is almost always guaranteed that stock is about to move either up or down.
Also, if the market has recently experienced a lot of volatility and the bands are far apart, this is a sign that the stock will settle down and trade into a range in the near future.
Parabolic SAR
Parabolic SAR indicator allows investors to evaluate the trend direction of a stock, to pinpoint entry and exit points and also placing trailing stops. The indicator is displayed as a series of dots.
PSAR can spot short-term price changes.
- When the stock price is trading below the Parabolic SAR, this can be interpreted as a signal to sell or remain short
- On the other hand, if the stock price is trading above the Parabolic SAR, this can be interpreted as a signal to buy or remain long.
Parabolic SAR indicator is used by investors in a similar way as the volatility stop. The main way investors use PSAR is as a trailing stop, in order to keep the initial stop in place until price moves sufficiently away from the entry and in order to adjust their profit exit.
Keltner Channels
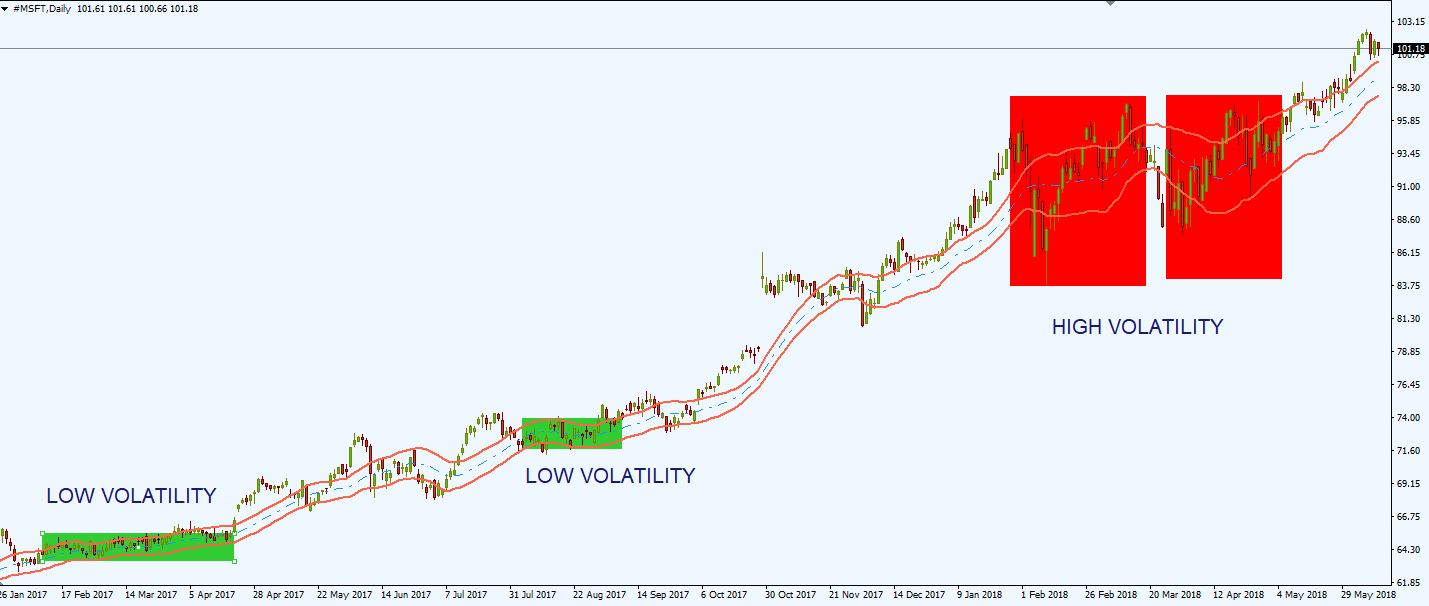
Keltner channels, created by Chester Keltner, are a combination of an exponential moving average and the Average True Range indicator. Keltner Channels use the Average True Range to determine the channel distance. The channels are typically set two Average True Range values above and below the 20-period exponential moving average.
Keltner Channels is another great indicator for measuring stocks volatility. This indicator responds to a simpler and more consistent measure of volatility: the range of each bar. Compared to the Bollinger Bands, Keltner Channels are more simple and consistent: big bars suggest more volatility, represented graphically by wider bands.
Donchian Channels
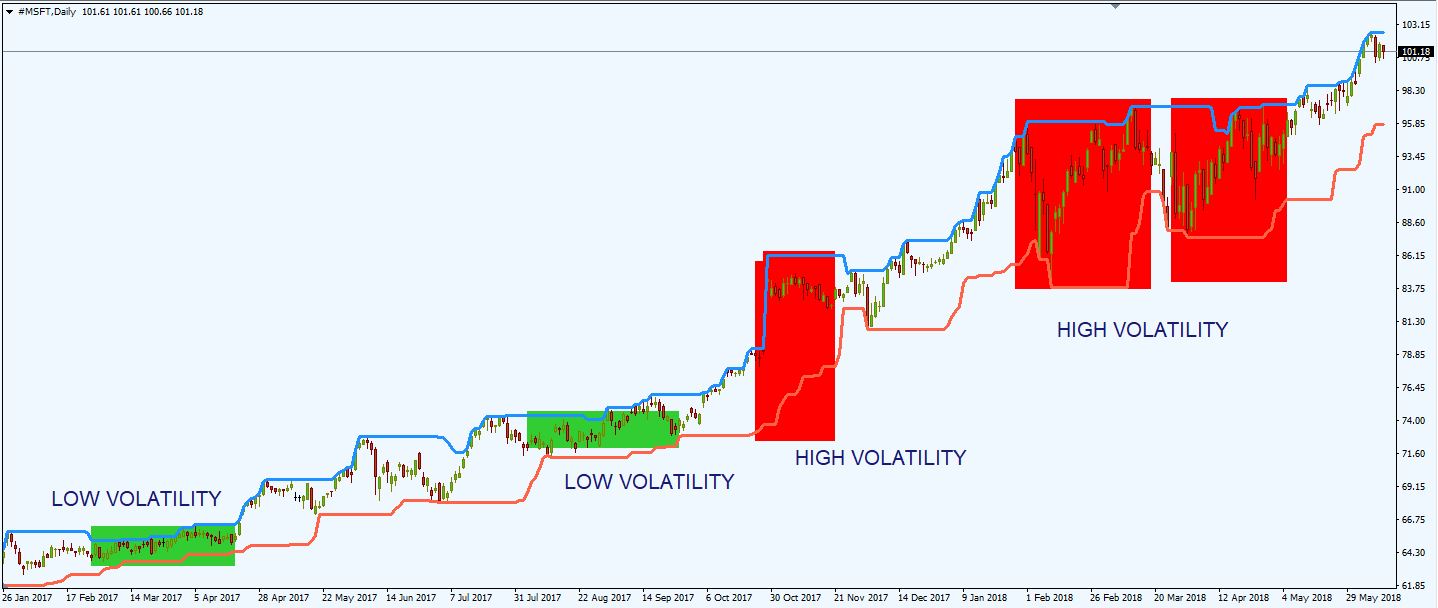
Donchian channels, developed by Richard Donchian, is an indicator formed by taking the highest high and the lowest low of a stock in the last n periods (usually 20). Donchian Channels are used primarily to determine volatility.
Donchian channels are wider when the stock recorded heavy price fluctuations and narrow when stock prices are trading in a range.
Investors use Donchian Channels as a support and resistance indicator:
- The upper band of the Donchian Channels is used for identifying long trades
- The lower band of the Donchian Channels is used for identifying short trades
Final Thoughts
Trading based only on volatility is a very hard technique. Theoretically, the best case scenario for a stock investor is to buy at the lowest point of volatility and sell at the highest point of it. In this scenario, he would capture the maximum profit, which in real life is unbelievably lucky.
Knowing if a stock is volatile or not is not enough. An intelligent investor must identify market fundamentals and combine volatility with other trend indicators or oscillators in order to gain a clear perspective on the stock.
Also, risk aversion plays an important role. An aggressive investor is constantly seeking for volatility, and he doesn’t like quiet markets. A conservative investor avoids volatile stocks and prefers trading with lower risk stocks that don’t record major fluctuations in short periods of time.
It’s up to you to discover the level of your risk tolerance and the degree of volatility you prefer to trade with.


