Table of Contents
What Is Donchian Channels
Donchian Channels is a technical indicator designed by Richard Donchian, a pioneer in futures trading. This indicator is similar to the Bollinger Bands and analyzes the evolution of the price by plotting the highest high and lowest low over a specific time interval. The most common settings for tracking the price’s higher highs and lower lows is 20-period.
How Are Donchian Channels Calculated
The Donchian channels indicator is represented graphically by three lines, one being the average calculated according to the preferred setting (20 or 55, etc.), and the other two lines mark the maximum and minimum zones (their position is based on the median line).
Donchian Upper Channel = Highest High over a specific time interval
Donchian Lower Channel = Lowest Low over a specific time interval
Donchian Middle Channel = (Donchian Upper Channel + Donchian Lower Channel) / 2
How To Read Donchian Channels
Donchian Channel Indicator To Measure Market’s Volatility
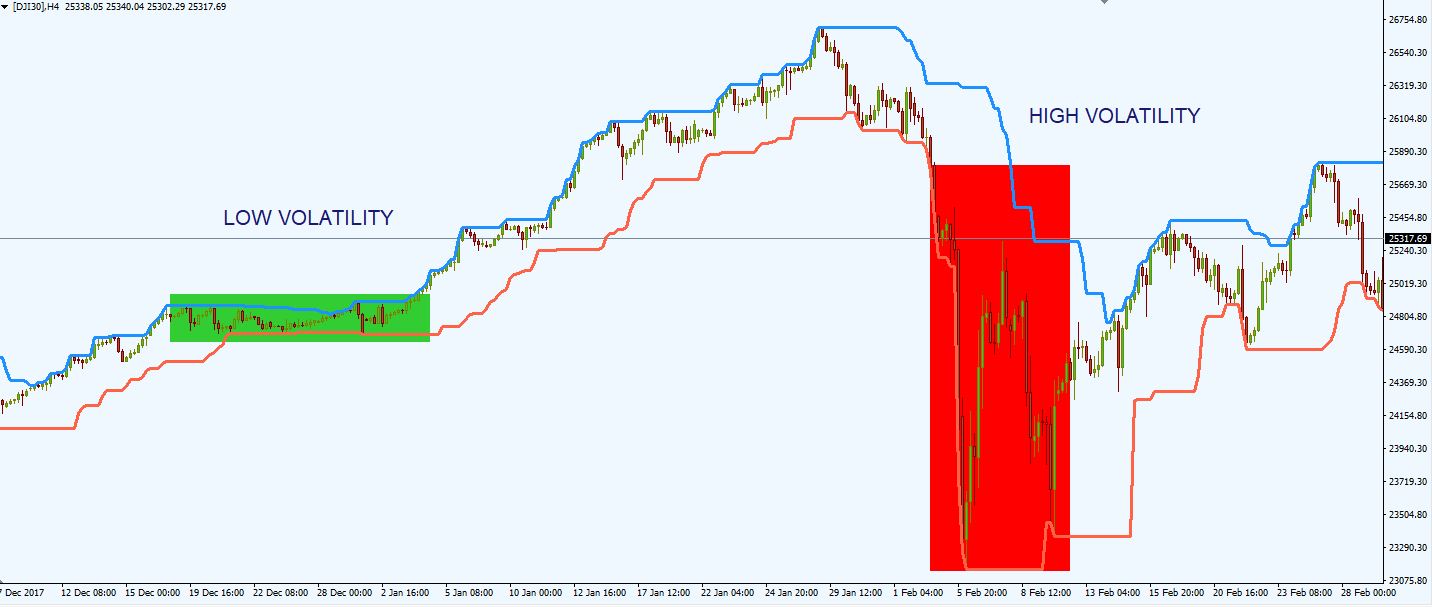
Donchian Channels is a useful indicator for measuring volatility in a market. The volatility measures the rate at which a security/stock moves. A volatile security/stock is one that records rapid fluctuations in price. A non-volatile or stable security/stock registers moderate price fluctuations.
Donchian Channels contract when the volatility is low and expand when volatility increases.
- During periods of low volatility, Donchian Channels are narrow
- During periods of high volatility, Donchian Channels expand drastically.
Trend Channel Indicator
Richard Donchian developed this indicator in an attempt to develop a mechanical trend trading system for futures trading that would keep the trader on the right side of any trend.
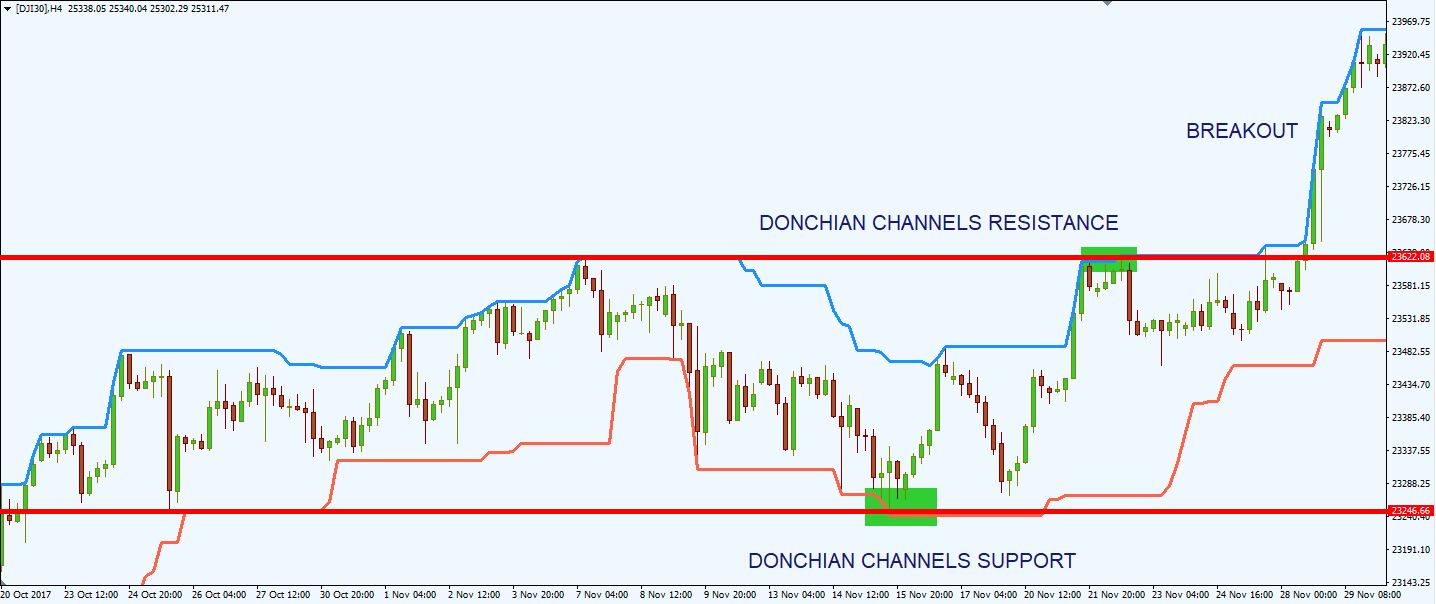
- when the price action breaks through and closes above the upper Donchian band, this signals an upward momentum and a possible buy signal
- when the price action breaks through and closes below the lower Donchian band, this signals a downward momentum and a possible sell signal
This may seem a little confusing if you are familiar with Bollinger Bands. Many traders assume that a breakout above upper or lower Donchian Channels signals an overbought or oversold area and a reversal could be on the cards. This assumption is wrong, trading with Donchian Channels is similar to support and resistance trading.
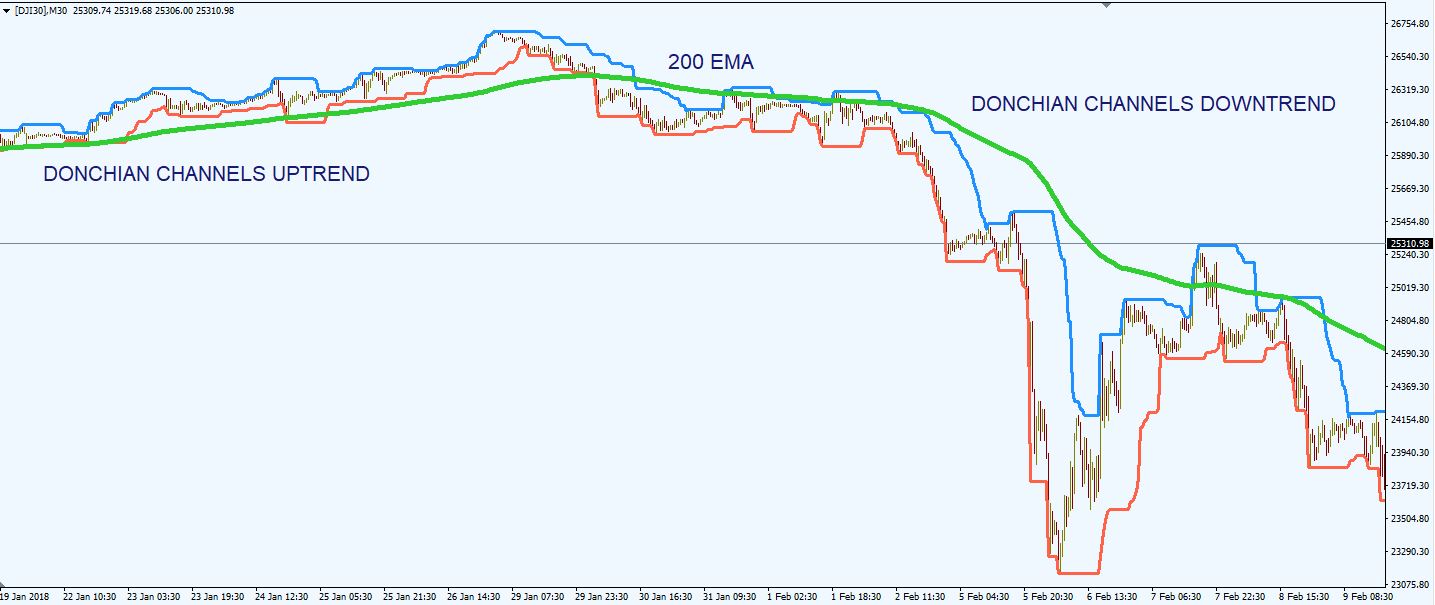
It’s simple: if the market momentum is able to surpass Donchian Upper Channel, then an uptrend could be developing. Conversely, if the market momentum breaks below the Donchian Lower Channel, a new downtrend could be developing.
Just like in the support and resistance case, once a support level is broken, the level becomes a resistance level and once a resistance level is broken becomes a support level.
Donchian Trend System – Dynamic Support and Resistance
The Donchian Channels is a great indicator to identify dynamic support and resistance levels during market trends. Most support and resistance levels, like market highs and lows, pivot points, round numbers etc. are static levels. Well, Donchian channels offer traders dynamic areas of support and resistance because are constantly changing depending on recent price action.
In a sideways market, when there isn’t a clear trend on the chart, Donchian channels provide excellent support and resistance, as most traders believe that there’s a high chance of prices staying within Donchian channels.
How To Trade Donchian Channel Indicator – Trading Strategies
Donchian Channels Vs Bollinger Bands Trading Strategy
As we previously explained, Donchian Channels is a useful indicator for measuring volatility in a market. It has almost the same characteristics as the Bollinger Bands.
Bollinger Bands is also an indicator that detects the volatility and dynamics of the price on the market. As in the case of Donchian Channels, the Bollinger Bands contract when the market volatility is low and expand when volatility increases. During periods of low volatility, the bands are narrow, while during periods of high volatility Bollinger Bands expand drastically.
Many traders like to compare these two indicators, to determine which one works best in certain market conditions. Of course, each of the indicators has its own advantages and limitations.
I prefer not to compare the indicators, but to use them both in the same trading system. I like to call this the “double volatility system”. Both indicators will track the market volatility, and at the same time will offer dynamic areas of support and resistance.
Let’s see what the system requires:
- Donchian channels with a 20-period input
- Bollinger Bands with a 50-period moving average with 3 standard deviations
In general, 99% of the price action is contained within 3.0 standard deviation of the Bollinger Bands. Now, I don’t know about you, but I prefer to trade with the odds in my favor. So, if a standard deviation of 3.0 will offer me around 99% certainty that the price won’t exit the Bollinger Bands, then I will be interested to trade only with these settings. 3 standard deviation on the Bollinger Bands will generate fewer trading signals, but high-probability signals.
Now that we determined the indicators used in this system, let’s see how we can generate some signals.
Low Volatility Scenario
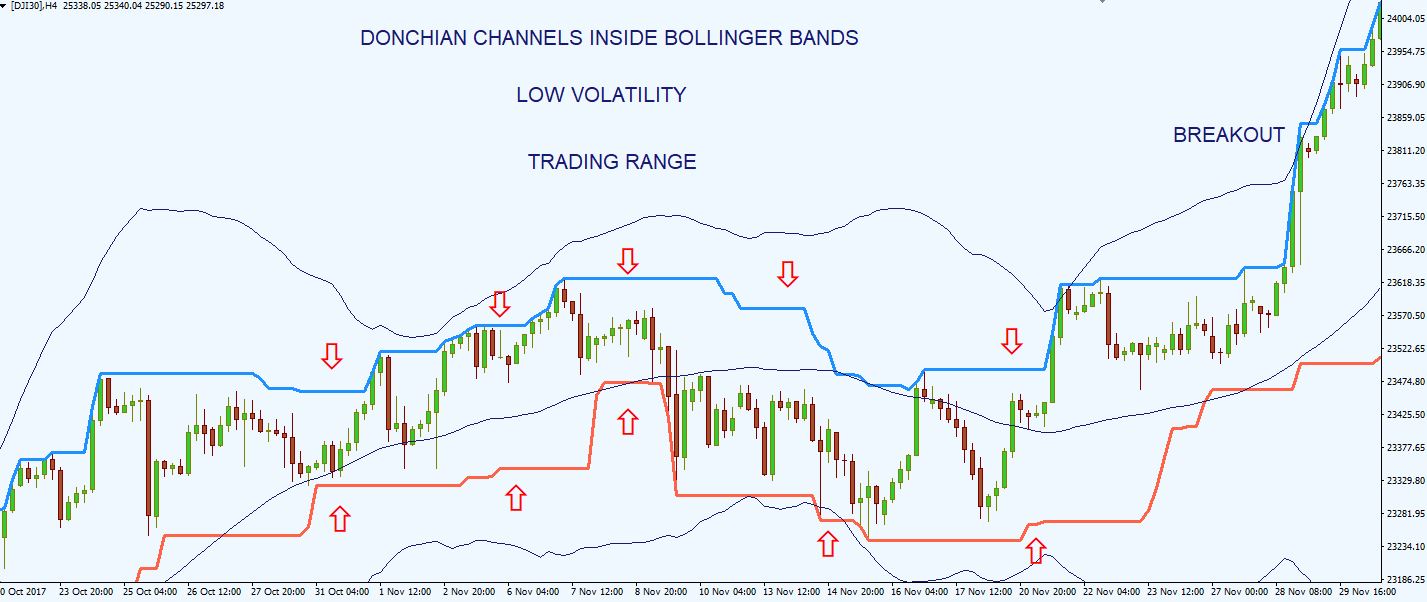
Let’s analyze the Dow Jones Index chart above. We plotted the Bollinger Bands and the Donchian Channels and we look at the range of the bands and at their position.
- When the market volatility is low, the Donchian Channels will often be perfectly located inside the Bollinger Bands. This translates into a trading range.
- The Bollinger Bands and the Donchian Channels will be parallel, with very little distance between the upper and lower bands of the indicators.
Many traders will avoid trading in this scenario, but to me, this represents a low-risk opportunity to trade around the support and resistance of the range.
Here’s what you should do:
- Determine the relevant static support and resistance levels – recent high swings and recent low swings, pivot points or even Fibonacci retracements
- Look for that areas to coincide with the upper and lower bands of the Donchian Channels and Bollinger Bands
- When this scenario occurs, buy at the support and sell at the resistance, with tight stop-loss orders and at least 2:1 risk reward ratio.
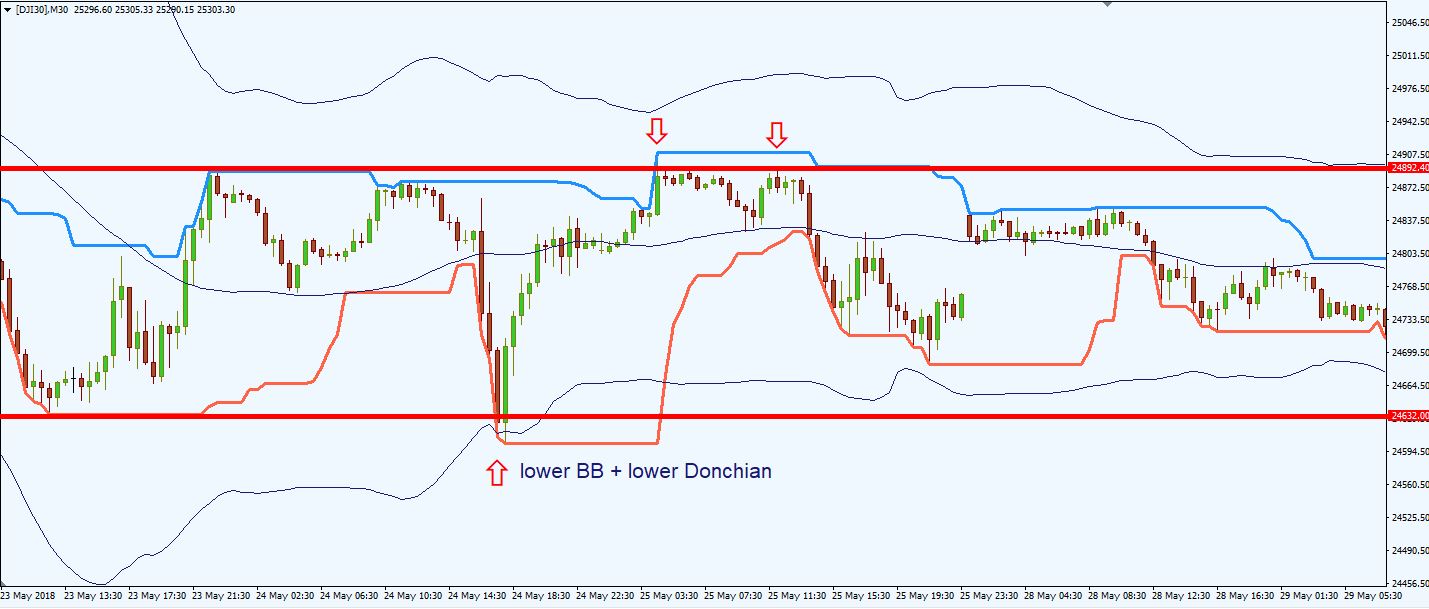
Let’s look at another chart, this time a 30-min Dow Jones Index chart.
We identified that the Donchian Channels are inside the Bollinger Bands, parallel and in a trading range. We determined the previous support and resistance levels and we waited for the price action to trade around those levels.
The first signal was a strong buy signal, as the price touched the lower Bollinger Band and the lower Donchian channel. This area coincided with the previous support level.
As you can see, the price rose all the way to the uppers side of the range. At the upper side, we had 2 sell signals, around the Donchian Upper Channel and the previous resistance area.
As we anticipated, the price was unable to continue its upward direction and started to go south once again. This time, the price was unable to reach the lower side of the range, stopping at the lower Donchian channel. Thus, we were unable to enter the market once again of the upside swing.
TIP: If you don’t like trading ranges, take only the trades in the direction you feel comfortable taking. For example, you could add a long-term moving average, like the 200-exponential moving average, and take only long positions above the 200 EMA or short positions below the 200 EMA.
Donchian Channel Breakout – Channel Breakout Forex Strategy
Trading during sideways price action has its advantages, but this technique isn’t suited for everyone. Many traders prefer to identify a breakout and ride the momentum that comes with it. Donchian Channels and Bollinger Bands can also assist investors in taking these breakout trades.
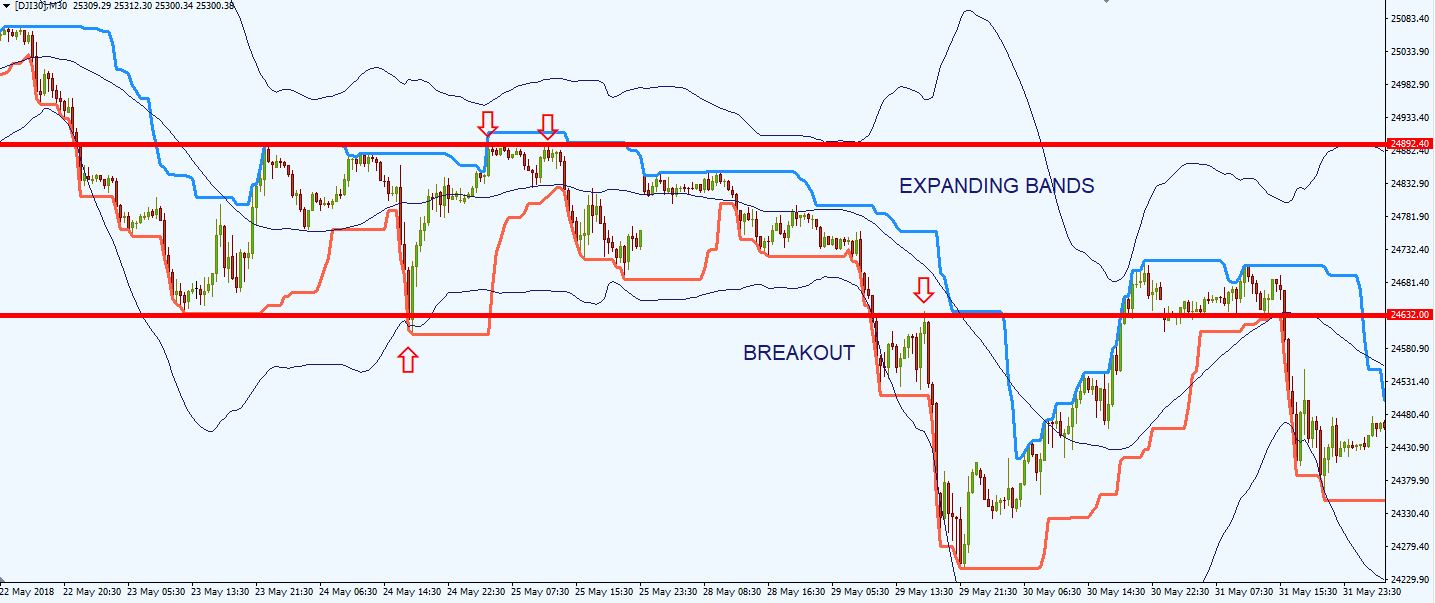
The principles mentioned for the low volatility scenario remain the same. You just have to wait for a breakout to occur in any side of the channel. Let’s take the previous example, and see what happens.
The price eventually broke that trading range, this time to the downside.
The Bollinger bands started to expand, meaning that the market volatility started to increase.
As the price retested the former area of support, this represented a good short signal, the price being near the upper side of the Donchian Channels.
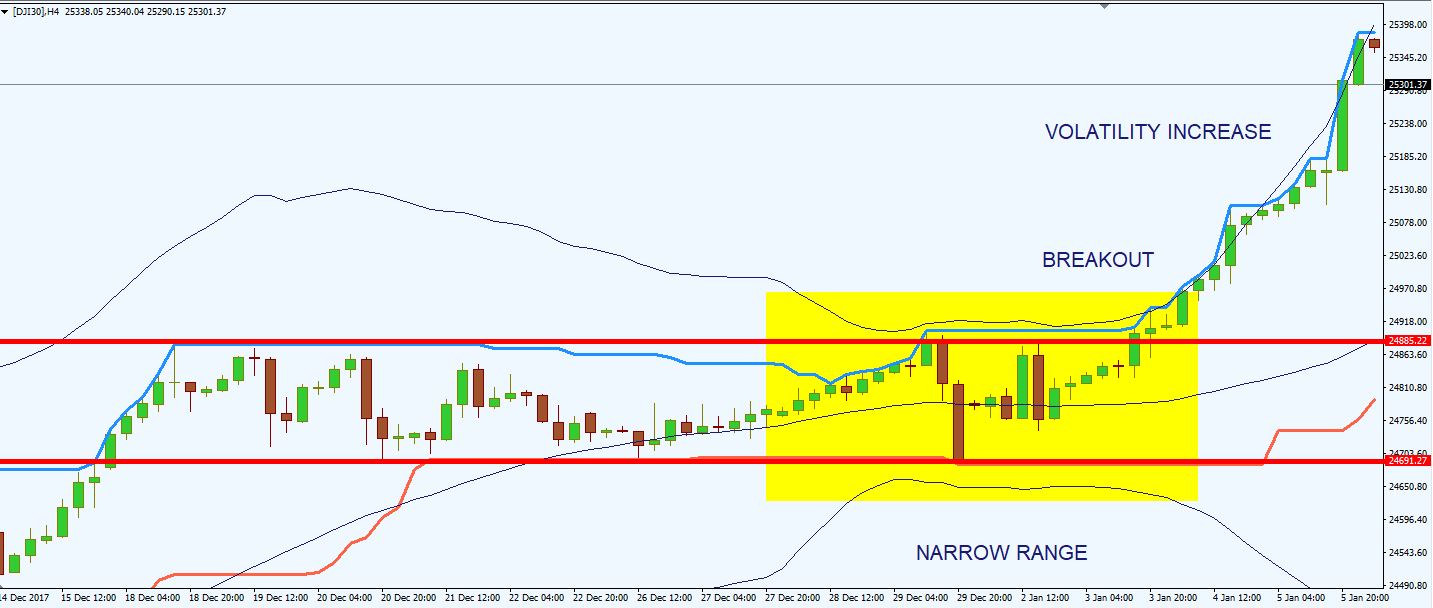
Here’s another example, this time a breakout to the upside. We identified a clear trading range, during a period of low volatility, with the Donchian Channels inside the Bollinger Bands. As the price closed below the range, the Bollinger Bands and the Donchian Channels started to expand.
This breakout was more aggressive, as it didn’t retrace to the previous resistance level, to retest the area.
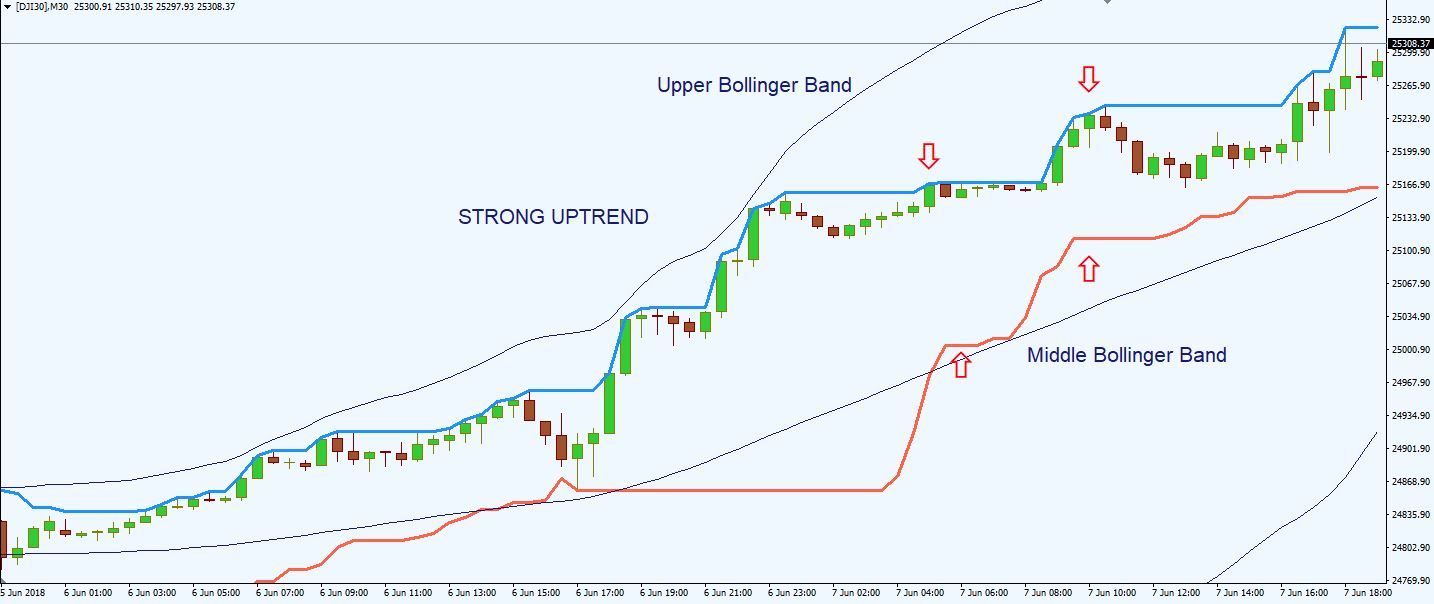
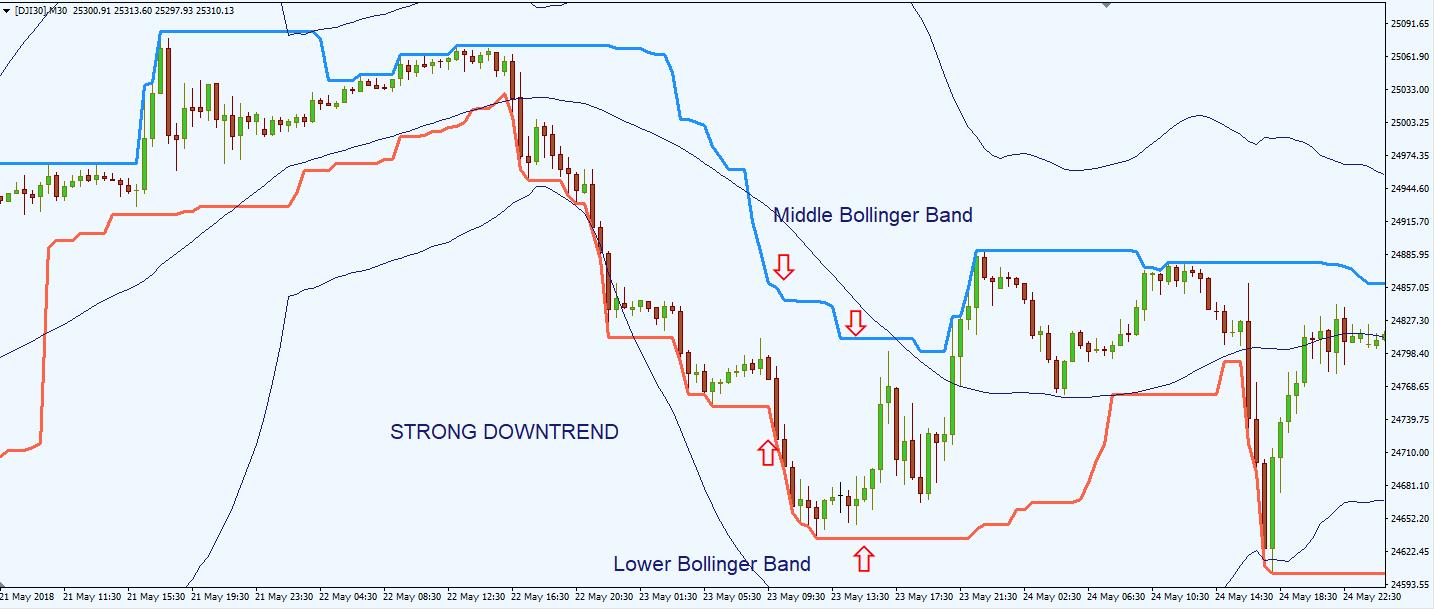
Donchian Trend System : Buy/Sell Middle Bollinger Band During Strong Uptrend/Downtrend
During a strong uptrend, the price often retraces to the middle Bollinger Band and continues its initial direction.
How I define a strong trend?
- when the Donchian Channels are included in the Middle Bollinger Band and the Upper Bollinger Band, I define this as a strong uptrend
- when the Donchian Channels are included in the Middle Bollinger Band and the Lower Bollinger Band, I define this as a strong downtrend
The idea behind this technique is that an overextended market will eventually reverse inside the bands. At this point, it is often possible to enter a trade in the direction of the original band touch.
The signals for this technique are simple:
- Buy near the middle of the Bollinger Bands after the market touches the lower Donchian Channels
- Sell near the middle of the Bollinger Bands after the market touches the upper Donchian Channels
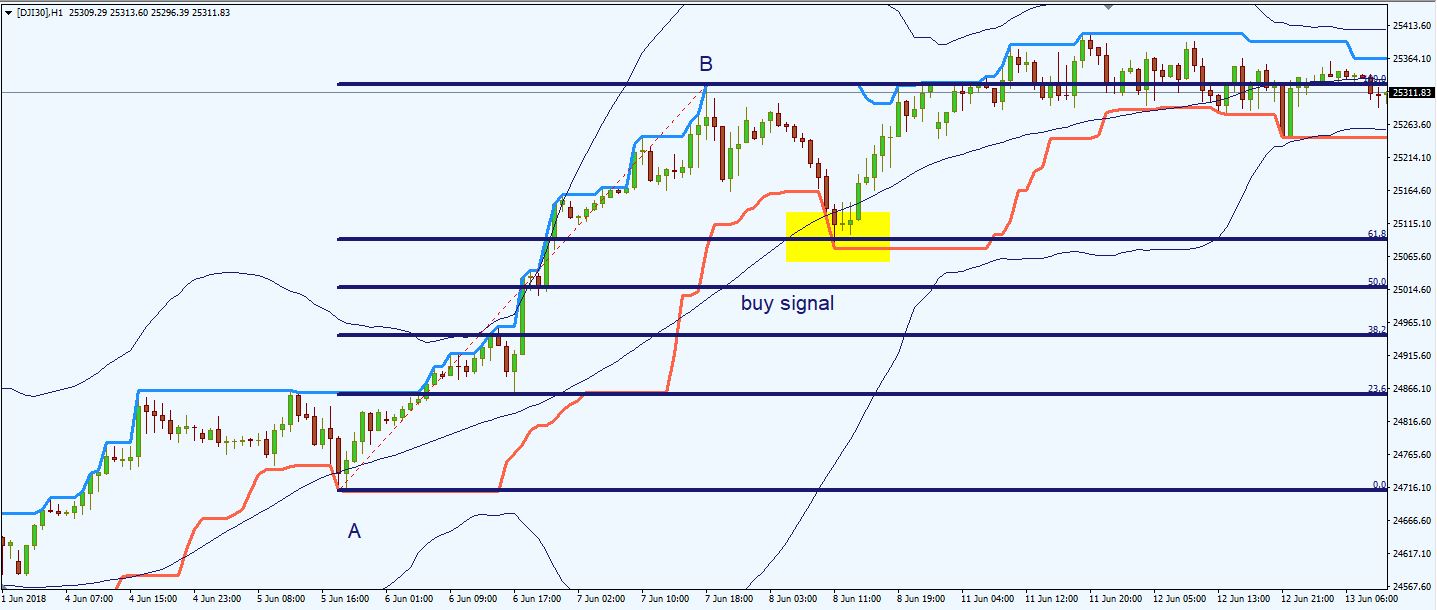
We don’t enter the market blindly when this happens. We must confirm this signal with other indicators. I prefer to use the static support and resistance levels – relevant market highs and lows, pivot points or Fibonacci retracements.
Let’s look at the chart above. The conditions for determining a strong upward trend are met, with the Donchian Channels (trend channel indicator) inside the middle and upper Bollinger Bands. We wait for the price to retrace around the middle Bollinger Bands. This area coincides with the 61.8 Fibonacci retracement level, drawn from the previous market swing. On top of that, we also had the lower Donchian Channel around that area.
As you can see, 3 support forces are located around the same area, determining the price to continue its upward direction.
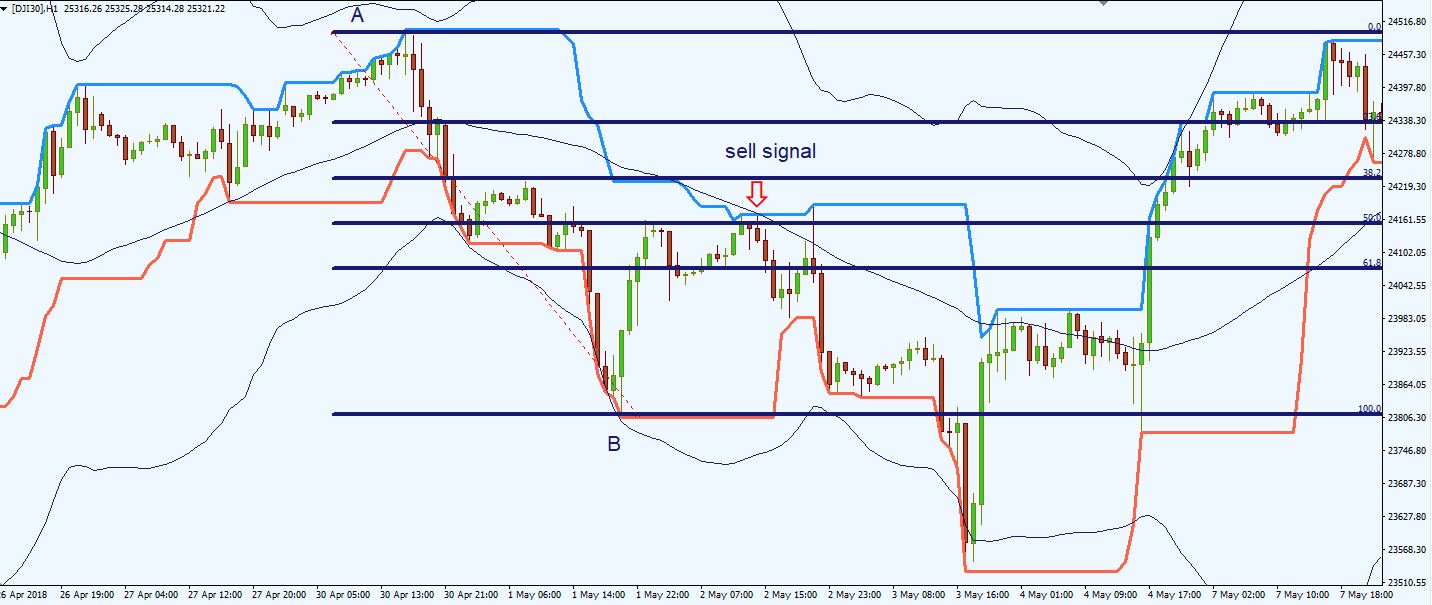
Let’s analyze a short signal. The conditions for spotting a strong downward trend are met, with the Donchian Channels inside the middle and lower Bollinger Bands. We wait for the price to retrace around the middle Bollinger Bands. This area coincides with the 50 Fibonacci retracement level, drawn from the previous market swing. Around that area, we also had the upper Donchian Channel.
So, the 50 Fibonacci retracement level, the middle Bollinger Band and the Upper Donchian Channel acted a strong resistance area and determined the price to continue its initial downward direction.
Donchian Channels and On-Balance-Volume Trading Strategy
On Balance Volume (OBV) is a momentum indicator that relates volume to price change. On Balance Volume indicator shows if market’s volume is flowing into or out of a security/stock.
The main assumption is that On Balance Volume movements precede price changes. OBV is a leading indicator and works excellent with Donchian Channels.
Let me explain how we can use this two indicators to complement each other and generate quality signals.
- We plot the Donchian channels with a 20-period input
- We add the On-Balance-Volume on the chart
- We plot a 200-exponential moving average on the on-balance volume (OBV), not on the price
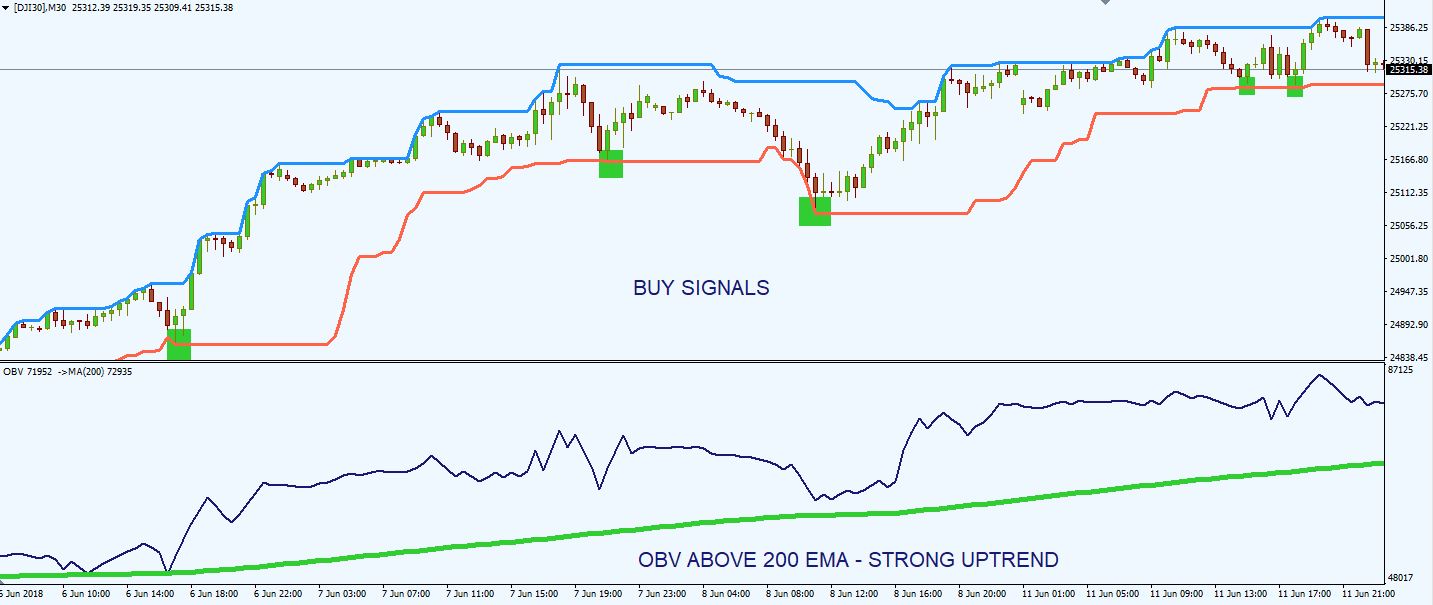
- We buy at the lower Donchian channel when the OBV trades above the 200 exponential moving average
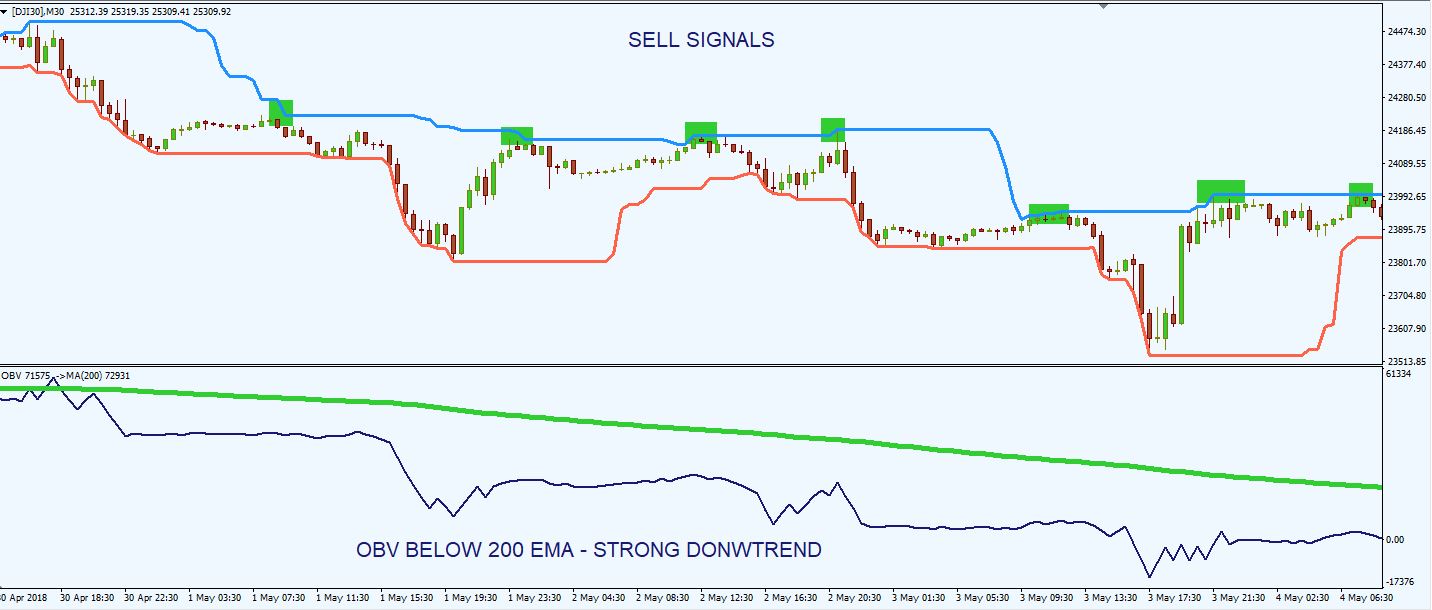
- We sell at the upper Donchian channel when the OBV trades below the 200 exponential moving average
- We place a tight stop loss, below the recent market swing and we aim for at least 2:1 risk reward ratio ( or we target the other side of the Donchian Channel, in order to capture bigger price fluctuations)
Let’s analyze the chart above. We can clearly see that the OBV is well above the 200 exponential moving averages, indicating a strong upward trend. As we are in an uptrend, we look to buy at the lower Donchian Channels. As the price trades near or touches the lower Donchian Channel, we can enter long on the market.
In the perfect scenario, we should wait for the price to touch the Donchian Channel (trend channel indicator), but in most cases, the price movement will stop a few pips above the targeted area. In some cases, the trend will be so strong and the price won’t come near the lower side of the channel. Markets are not perfect, so it all depends on your style to enter the market.
Above we have another chart, this time with short entries. We can observe that the OBV is well below the 200 exponential moving averages, indicating a strong downward trend. As we are in a donwtrend, we look to sell at the upper side of the Donchian Channels. As the price trades near or touches the upper Donchian Channel, we can open short positions on the market.
As you can see, in a strong trend, the on-balance volume as a leading indicator and the Donchian Channels form a great partnership. Of course, you could add other filters to confirm the market entries, but I like to keep it simple and use just the 2 indicators. You don’t want to overcomplicate the charts.
Donchian Channels – Pros And Cons
- ↑ works well in non-trending market conditions
- ↑ excellent indicator for measuring market volatility
- ↑ useful at identifying overbought and oversold areas on the chart
- ↑ acts as a dynamic area of support and resistance
- ↑ good at identifying big movements on the market
- ↓ bad at identifying cycle turns, giving a lot of false signals
- ↓ does not contain all of the data necessary for proper analysis of price action, so it should be used in combination with other tools

