Table of Contents
What Is Money Flow Index (MFI)
The Money Flow Index (MFI), developed by Gene Quong and Avrum Soudack, is a momentum oscillator that measures the strength of money flowing in and out of a security/stock. Money Flow Index is related to the Relative Strength Index, but with a twist. While RSI only incorporates prices, the Money Flow Index also incorporates the volume.
Money Flow Index (MFI) Calculation & Settings
I mainly use MFI in H4 and D1 timeframes, with a setting of 5, instead of standard 14. This is how MFI is built in this particular case:
1. We determine the typical price
Typical Price = (High + Low + Close) / 3
2. We determine the Raw Money Flow
Raw Money Flow = Typical Price x Volume
3. We determine the Money Flow Ratio
Money Flow Ratio = (Positive Money Flow of 5 Periods) / Negative Money Flow of 5 Periods)
4. We determine the Money Flow Index.
Money Flow Index = 100 – 100/(1 + Money Flow Ratio)
How To Read Money Flow Index (MFI)
• when current Typical Price is higher than the previous Typical Price, it is considered Positive Money Flow
• when current Typical Price is lower than the previous Typical Price, it is considered Negative Money Flow
• Positive Money Flow represents the sum of the Positive Money over the specified number of periods
• Negative Money Flow represents the sum of the Negative Money over the specified number of periods.
• Money Flow Index indicates the percentage of positive money flow compared to the total money flow.
How To Trade With Money Flow Index (MFI) – Signals and Trading Strategies
Money Flow Index (MFI) Overbought/Oversold Divergence Trading Strategy
As the Money Flow Index (MFI) is quite similar to RSI, the indicator can be used in a similar way. The MFI can offer traders several signals, the main of them being overbought/oversold conditions and divergences.
When the MFI is above 90, the price is considered overbought and a reversal or pullback could be on the cards. When the MFI is below 10, the price is considered oversold and a reversal or pullback might occur on the market.
It is important to remember that simply because a market reaches overbought or oversold levels, does not mean that market prices will immediately reverse in the opposite direction. During periods of strong upward trends of downward trends, markets can remain in the overbought or oversold areas for days, weeks or even months.
That’s why when the MFI hits or exceeds values of 90 or 10, signaling overbought and oversold, you should not automatically enter counter trend positions. That’s a wrong approach to what concerns the money flow index. Sometimes the prices can stay a long time in the overbought or oversold areas and during that time prices can continue to go higher or lower.
Another great use of the Money Flow Index is to watch for divergences between the MFI and the price of the security/stock. For example, when prices rallied to a new high but the MFI cannot increase to a new high, then we have a divergence.
I prefer to combine these 2 approaches to trade the Money Flow Index and merge them into one signal, and further filter the signal with a trendline break.
Money Flow Index Trading Strategy Rules
- The Money Flow Index must reach an overbought or oversold area at least once on the chart in the recent trading period.
- A divergence between the money flow index and the price must occur during the recent period.
- We plot a 200-period exponential moving average, to determine the main direction of the market.
- We only take signals in the direction of the 200 EMA. If the price is trading below 200 EMA, we’ll take only short signals. If the price is trading above 200 EMA, we’ll take only long signals.
- Search for entries once the price breaks through the recent support or resistance level – trend line or channel.
- Stop loss orders should be placed above or below the recent market swing.
- Aim for a minimum 2:1 risk reward ratio.
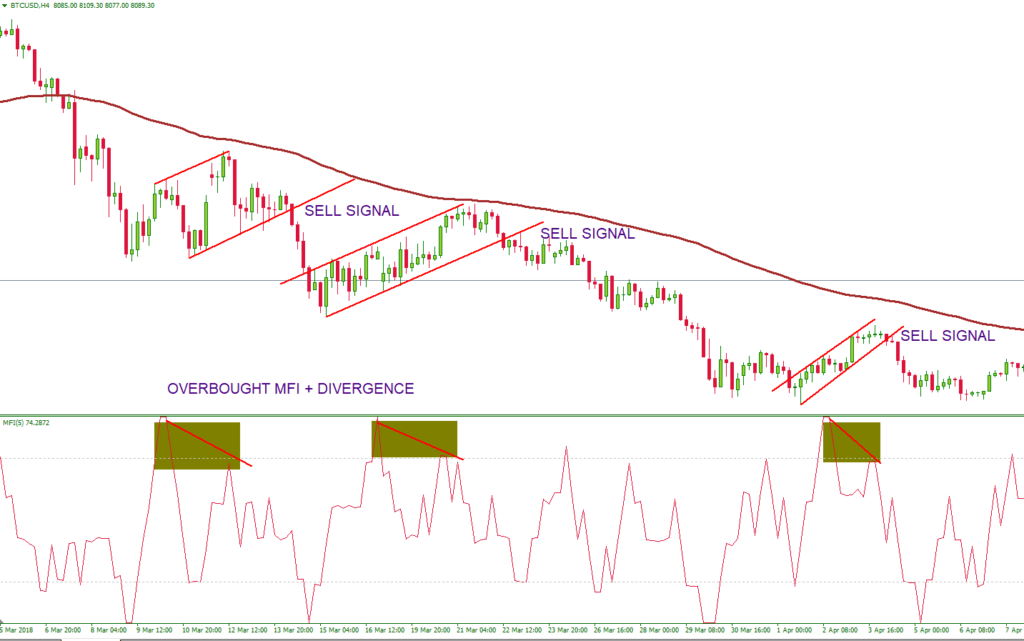
As we can observe on the Bitcoin chart above, the system generated 3 valid entries for short positions and all conditions described were met :
- MFI reached an overbought area at least once
- A divergence between the MFI and the price.
- 200-period exponential moving average – 200 EMA was pointing downward, indicating a bearish trend.
- Sell signal confirmed after the lower trend lines of the channels were broken to the downside.
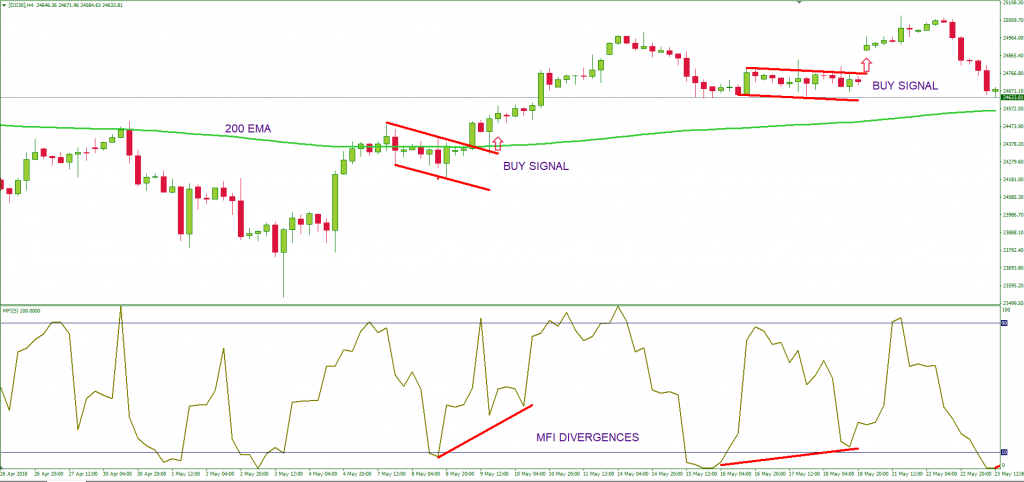
Let’s look at another chart, this time a Dow Jones Index H4 chart.
This time we had a bull market, indicated by the 200-period exponential moving average. The system generated 2 valid signals during this period, as all the trading conditions were met: oversold MFI, a divergence between the MFI and price, the upper side of the channels broken to the upside.
TIP: I only trade the MFI with a 5-period input and on the H4 or Daily charts. This strategy is suited for swing traders and even position traders when used on W1 charts.
Money Flow Index (MFI) Trendline Breakout Strategy
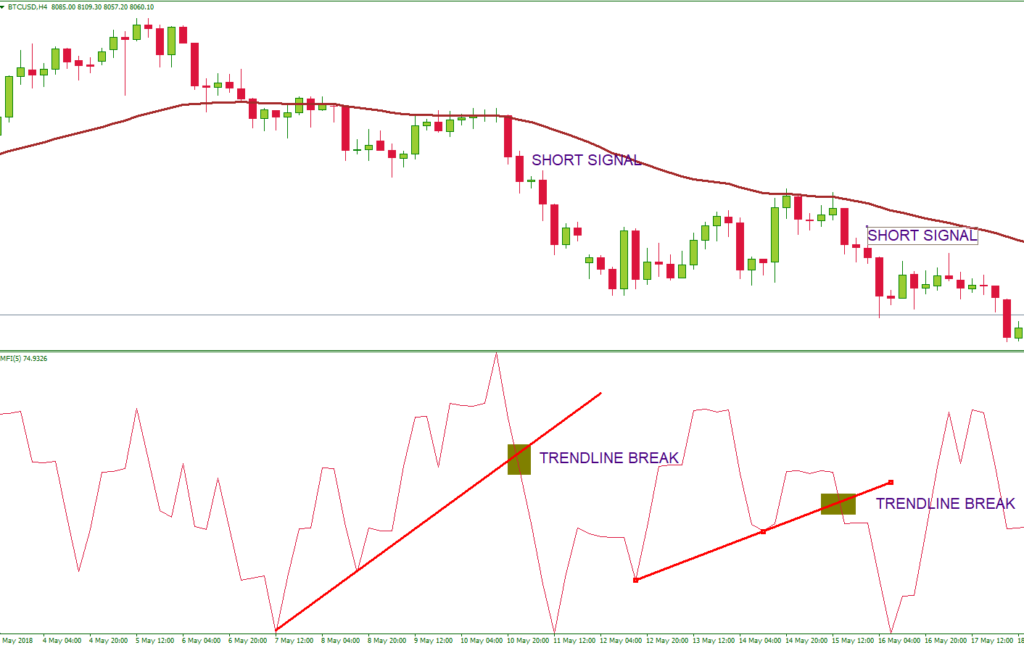
Another useful method to trade the money flow index is by drawing trendlines on the oscillator, and not on the price. I determine the main trend by adding a moving average – EMA50 or EMA 200 – and I only take signals in the direction of the main trend.
The technique is simple but accurate:
• Draw trend lines by connecting the most recent 2 MFI swings – not price swings
• Search for setups in the direction of the trend
• Enter the trade once the MFI trendline is broken and seek an optimal entry point on the smaller timeframes, usually on H1 charts
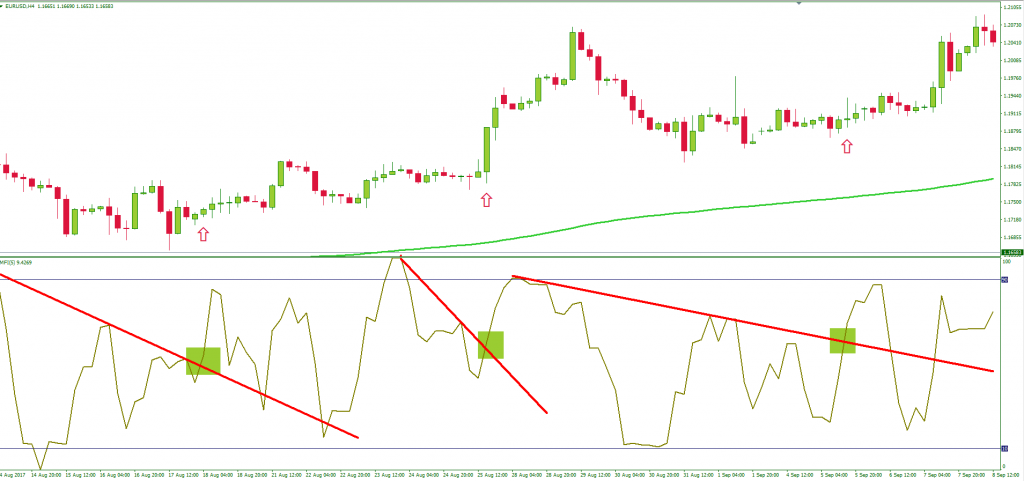
Let’s analyze the EUR/USD MFI chart above. We had a strong upward trend confirmed by 200 EMA, so we are looking at the upper side of the money flow index to draw trend lines between the recent MFI swings. The system generated 3 valid long setups once the price broke the respective areas of resistance on the money flow indicator.
Money Flow Index (MFI) 50-Level Crossover Trading Strategy
Another way in which traders use the money flow indicator is to take signals when the oscillator crosses the 50 level.
- when money flow index indicator crosses above 50 level, this signals buying pressure coming into the market
- when money flow index indicator crosses below 50 level, this signals selling pressure coming into the market
Let’s take a Dow Jones Index chart as an example.
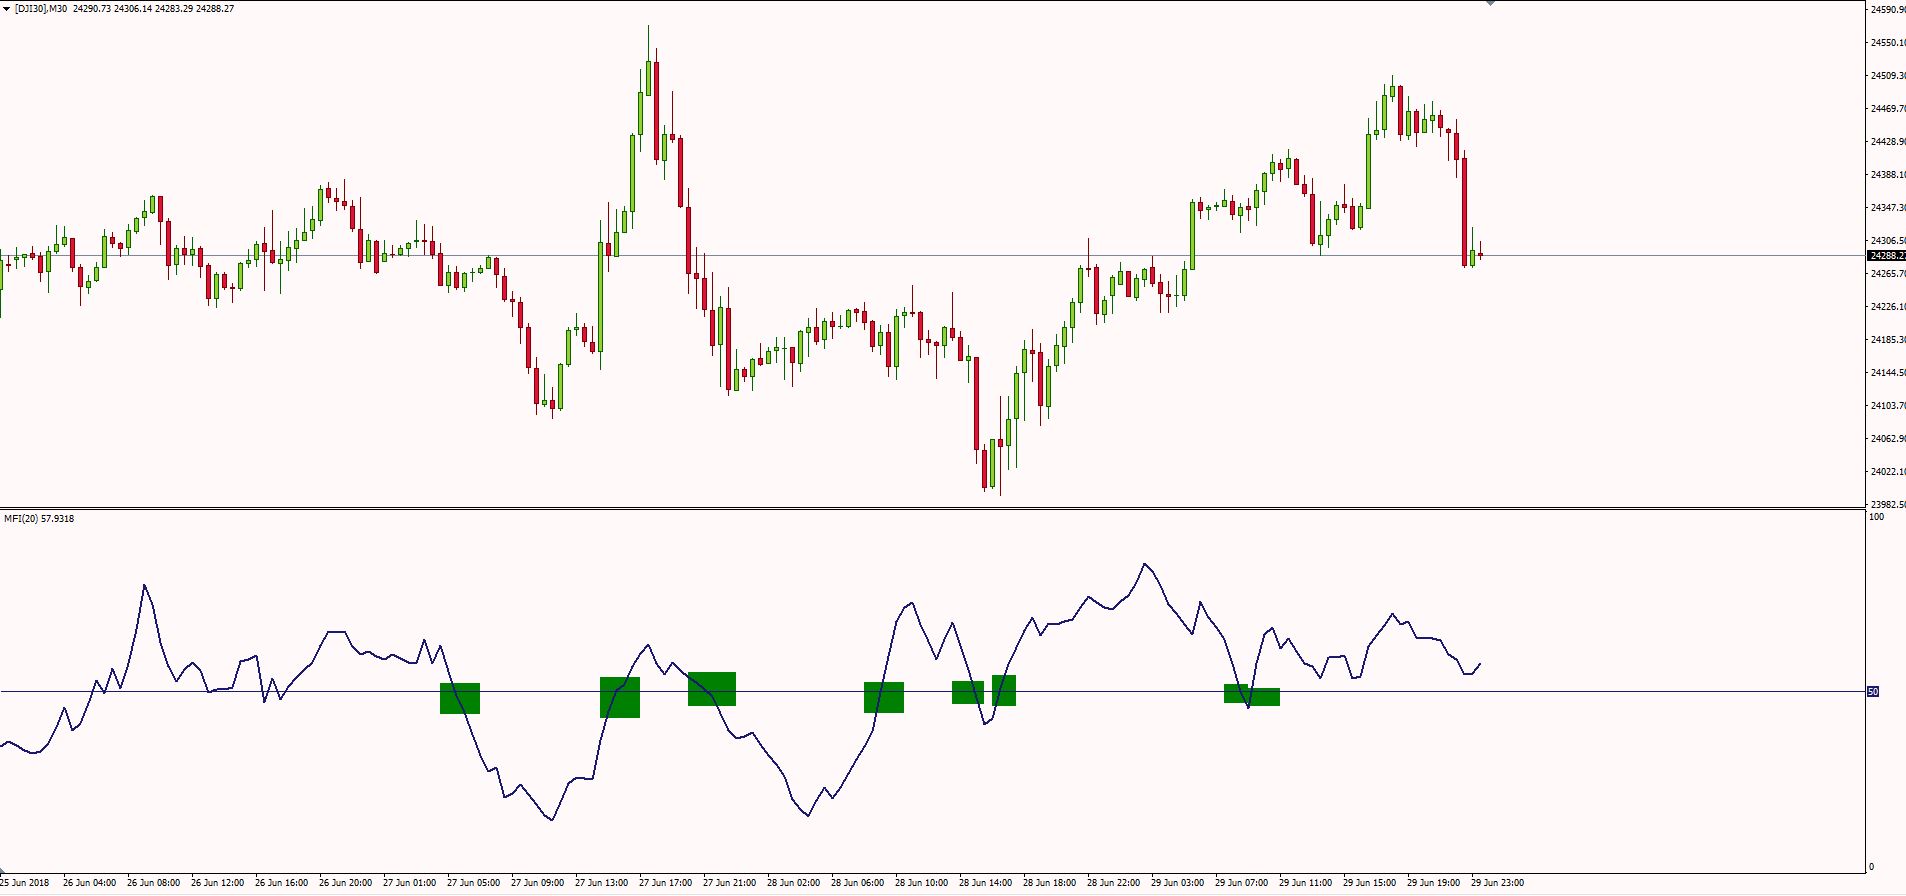
We plotted the money flow index calculated in the last 20 days. As you can see, the 50-level crossover offered some good entries, but it also generated a few bad trades.
The main problem with this method is the market noise it generates. Traded by itself, this technique is not profitable in the long run.
That’s why we have to smooth the indicator by calculating it on a longer period. This way we try to eliminate a part of false signals and reduce market noise.
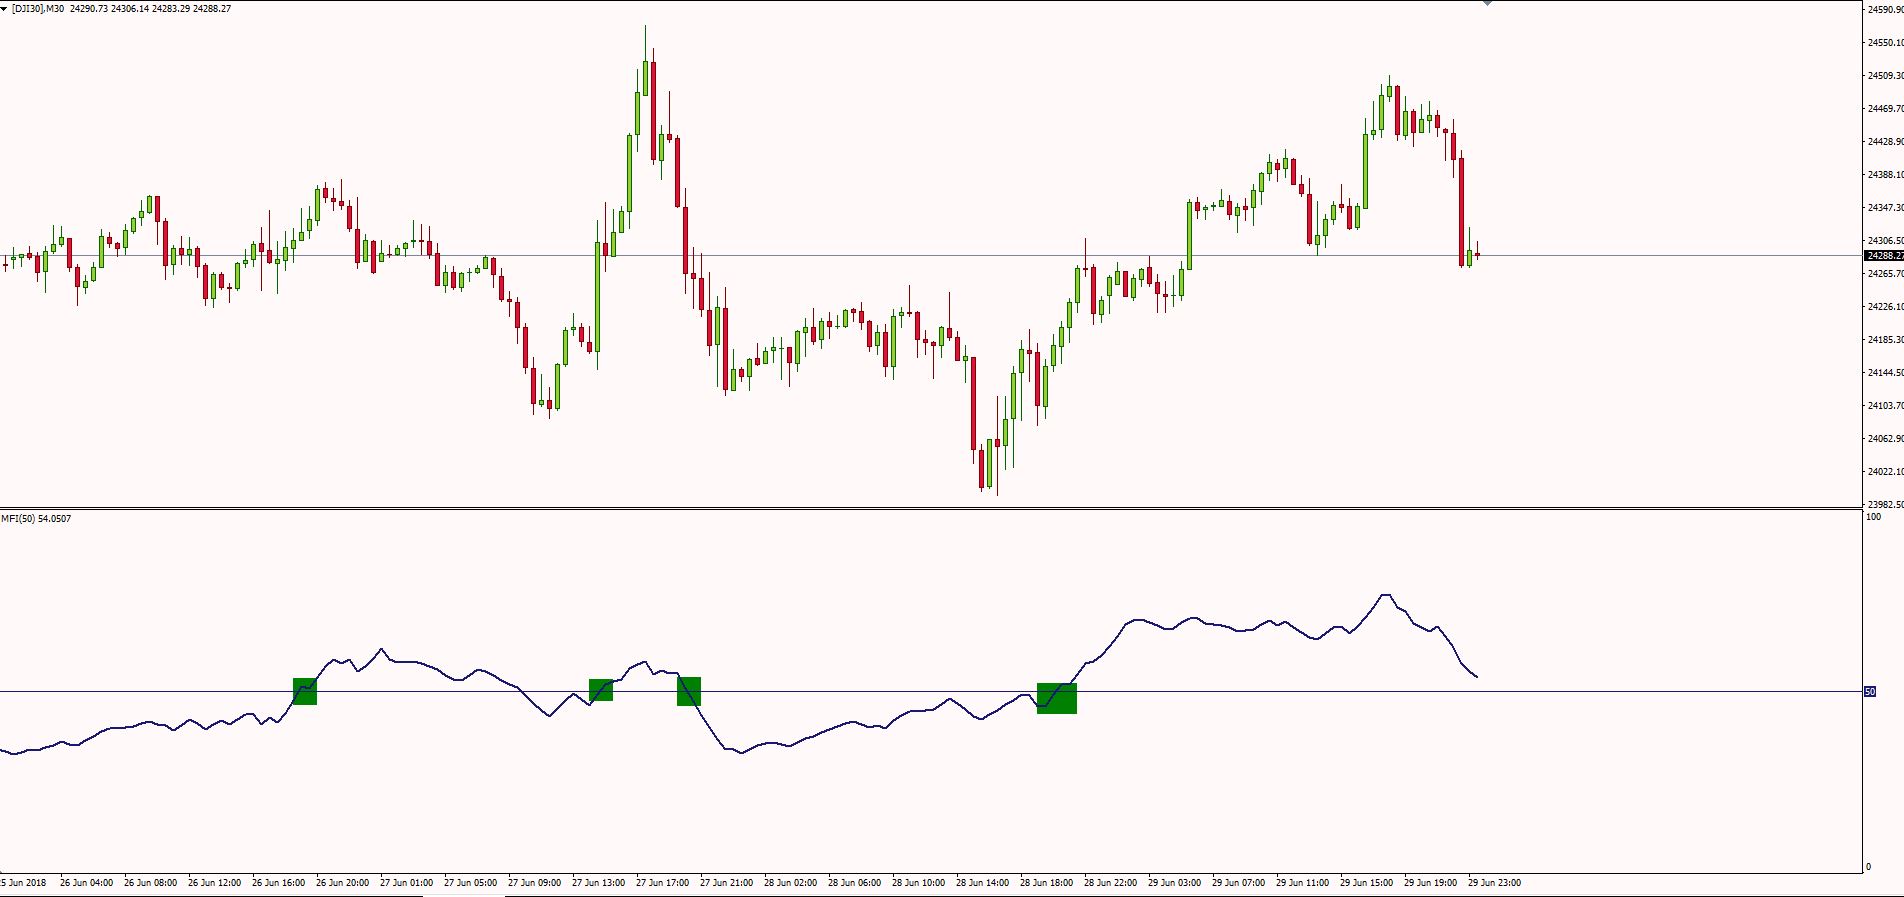
Here’s the same chart, but this time we added the money flow index for the last 50-periods.
Already we see some improvements in the signals generated. By smoothing the money flow index, we force the indicator to generate fewer, but more quality signals.
Also, keep in mind that this example is basically a trading range. Let’s see how money flow index looks like during a trending scenario.
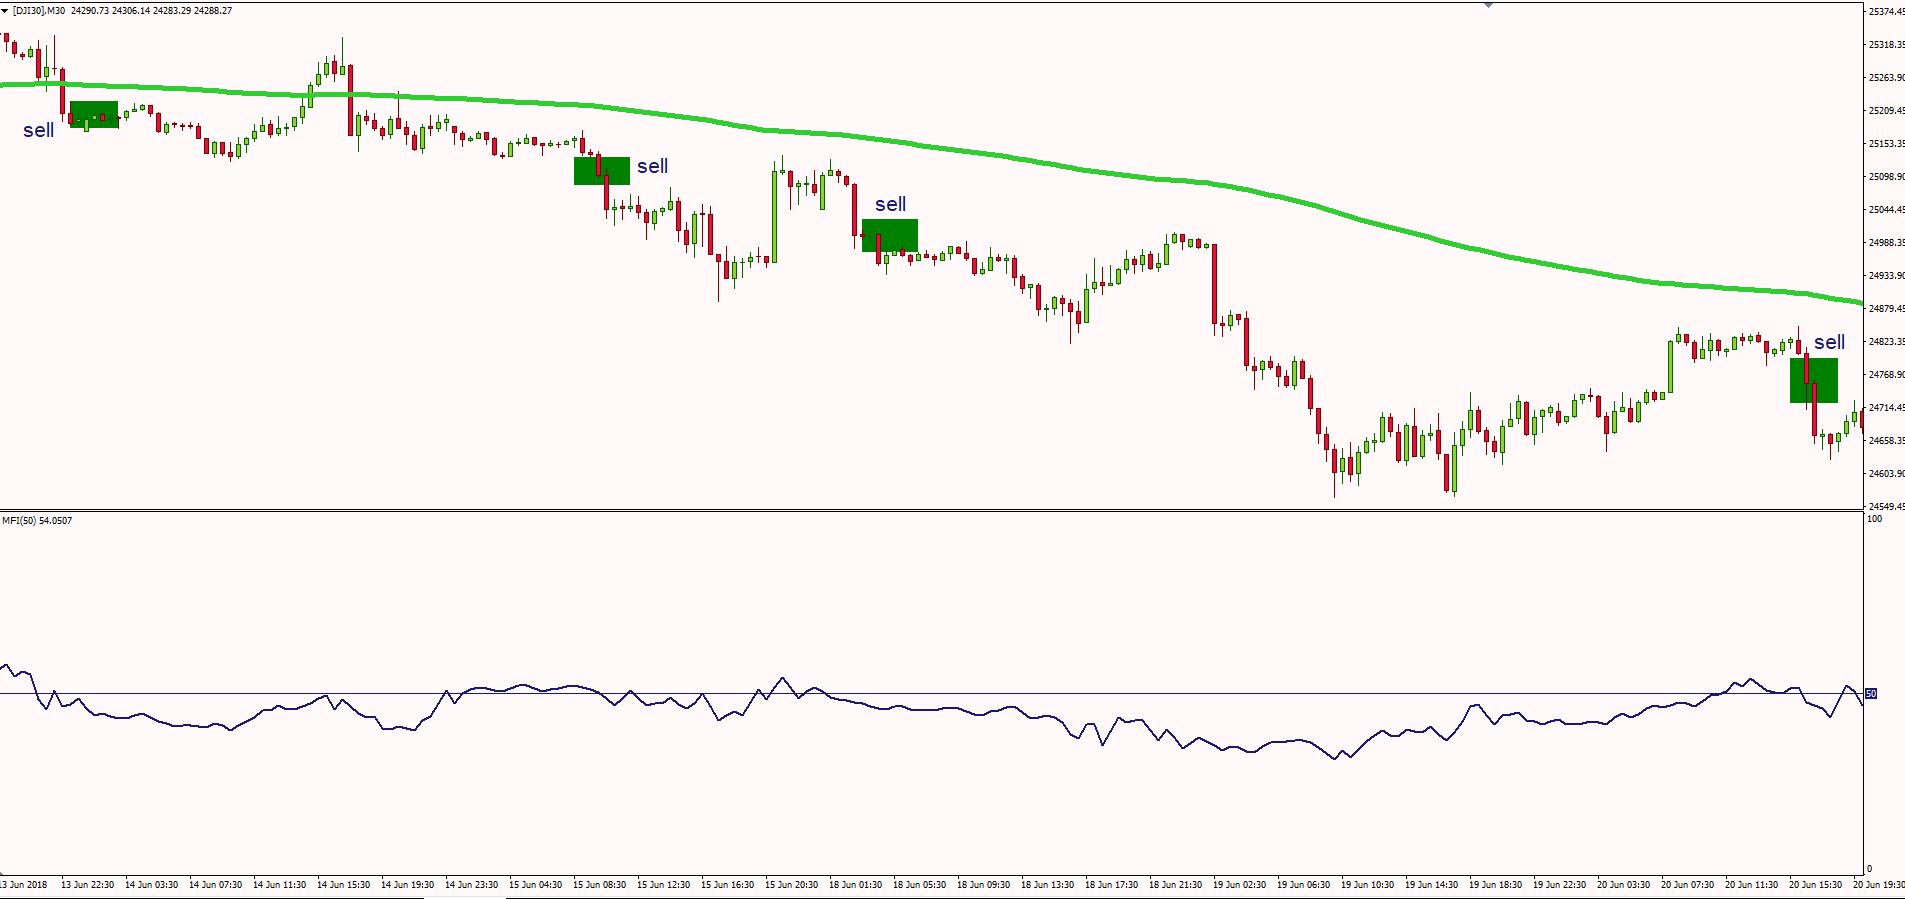
Now that’s much better. We added a 200-period exponential moving average to estimate the market trend and 50-period money flow index.
This time, the signals are obvious. This setup generated 4 valid short entries, in line with the trend.
Money Flow Index – Moving Average Crossover Trading Strategy
We already established that in order to profit from the financial markets when using the money flow index, we need to smooth the indicator.
There is another method for smoothing the signals offered by the money flow index indicator. This technique involves adding a moving average on the indicator.
By adding a moving average on the money flow index chart window, we seek to take crossover signals.
Now, when if we want to trade a crossover between the money flow index oscillator and a moving average, we must be aware that a crossover will catch good movements when markets are trending. When markets are trading in a range, this system is subject to whipsaws, which will lead to losing trades.
This system will offer many false signals if we don’t add some filters to the trading system.
One of my preferred indicators is the pivot points. Pivots Points are an accurate indicator as the most market participants are watching and trading these key levels. Part of what makes the Pivots Points so reliable is the fact that they are based purely on price.
I prefer to focus mainly on the central pivot point and take all my trades around that area.
So, let’s see how we can use the money flow index – moving average crossover in combination with pivot points.
The rules of this setup are simple. We aim to take positions in the market mainly based on the crossover between the 50-period money flow index and the 200-period exponential moving average.
As in the previous technique, we decided to use longer periods on the money flow index and the moving average, in order to eliminate market noise. We don’t want crossovers all over the place. We want fewer, but reliable signals.
This system is suited for swing trading and position trading, so it will require patience and discipline.
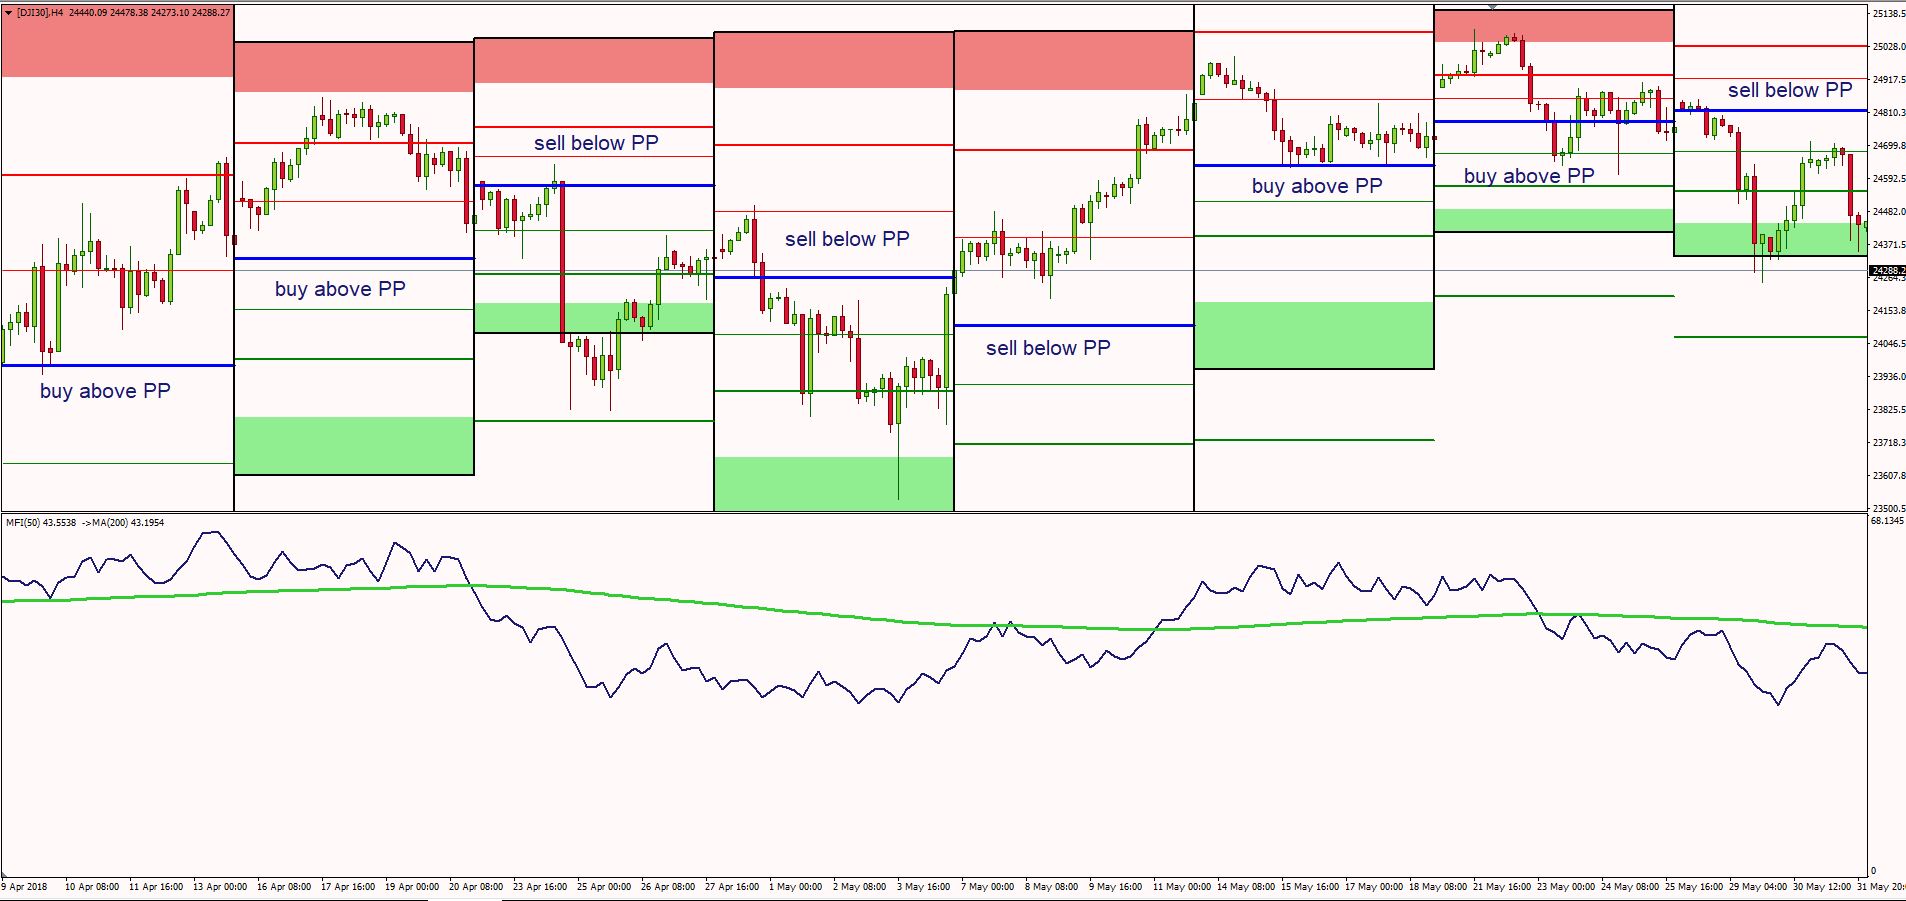
Here is an H4 Dow Jones Index MFI chart with the weekly pivot points added. Now that we have the crossover all set, we need to find market entries. I prefer to focus only on the central pivot point and take entries around that level.
This example includes 8 trading days. Based on the money flow index-moving average crossover, we determine the intraday outlook.
As you can see, on the first day we seek to buy the weekly central pivot point. The next day we also have a buy only day.
As the money flow index crossed below the 200-period moving average, during the third day we searched for short positions below the weekly pivot. The fourth day was also a sell only day.
You get the picture. We target our entries based on the crossover between the money flow index and the 200 EMA, but only around the central point. That’s the key, the entry must occur around that level.
If the market doesn’t retrace to that level, we seek for other instruments to trade.
Money Flow Index – Pros And Cons
• ↑ excellent at identifying divergences on the chart
• ↑ useful at identifying overbought and oversold areas on the chart
• ↑ good during a trending market condition, combined with moving averages
• ↓ lagging indicator and can produce numerous whipsaws if not used correctly
• ↓ does not contain all of the data necessary for proper analysis of price action, so it should be used in combination with other tools

