Table of Contents
What is Price Rate Of Change (ROC) Indicator
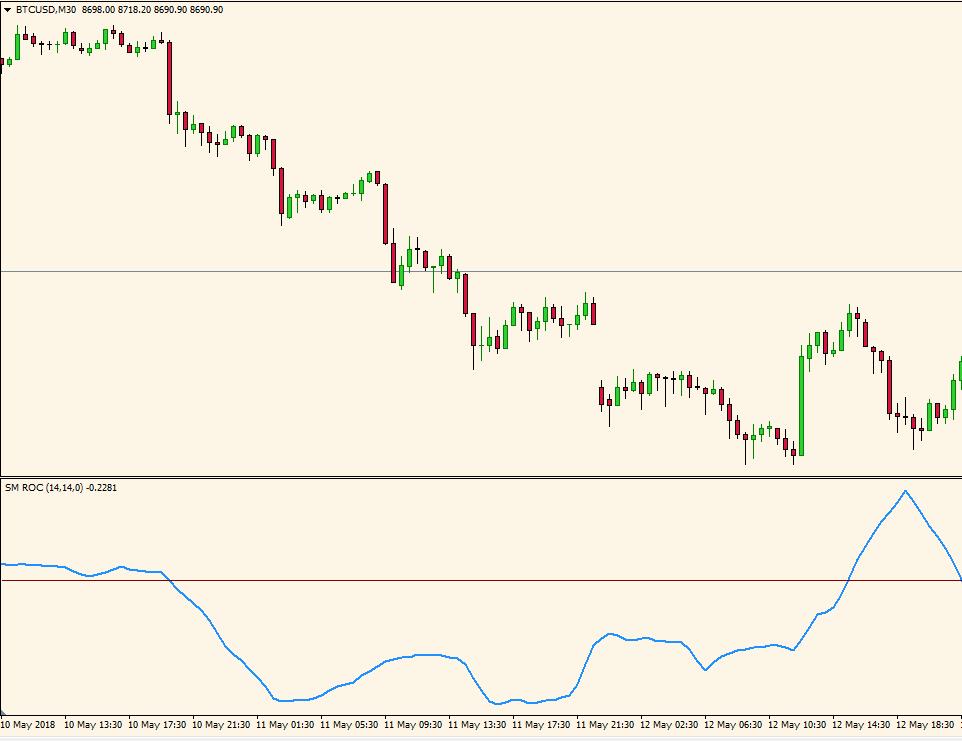
The price rate of change (ROC) indicator represents a momentum oscillator, measuring the speed at which the price is changing within a defined time period. The rate of change (ROC) calculates the percentage change between the most recent price and the price registered “n” periods ago. The plot forms an oscillator fluctuating above and below the zero line as the rate of change moves from positive to negative.
How to Read Rate Of Change (ROC)
A value above zero indicates an increase in bullish momentum and a negative value suggests an increase in downward momentum. Like other momentum indicators (Stochastic oscillator, for example), ROC can be interpreted in numerous ways, traders using this oscillator for overbought/oversold signals, divergences and zero-line crossovers.
How Rate Of Change (ROC) Works – Price Rate Calculation
The formula for calculating the rate of change involves taking the current price minus the price on N days ago and then divide it with the price N days ago.
ROC = [(C – CN) / CN] x 100
C = Close
N = Number of periods ago
Traders use the movement of the rate of change to interpret whether the price is in an upward or downward trend by looking at the speed at which a variable changes over a specific period of time.
For most parts, current price rate and ROC move together. When the current price and ROC are moving in opposing directions, the traders look to the rate of change for a clearer indication of the current trend.
How To Use Rate Of Change (ROC) | Signals and Trading Strategies
Rate Of Change Zero-Line Crossovers Trading Strategy
Maybe the most common way traders use the ROC oscillator is entering the market when the plotted line crosses the zero line. A breakout in either direction indicates increasing /decreasing momentum. When combined with other trend indicators, the ROC can pinpoint some excellent entries on the market.
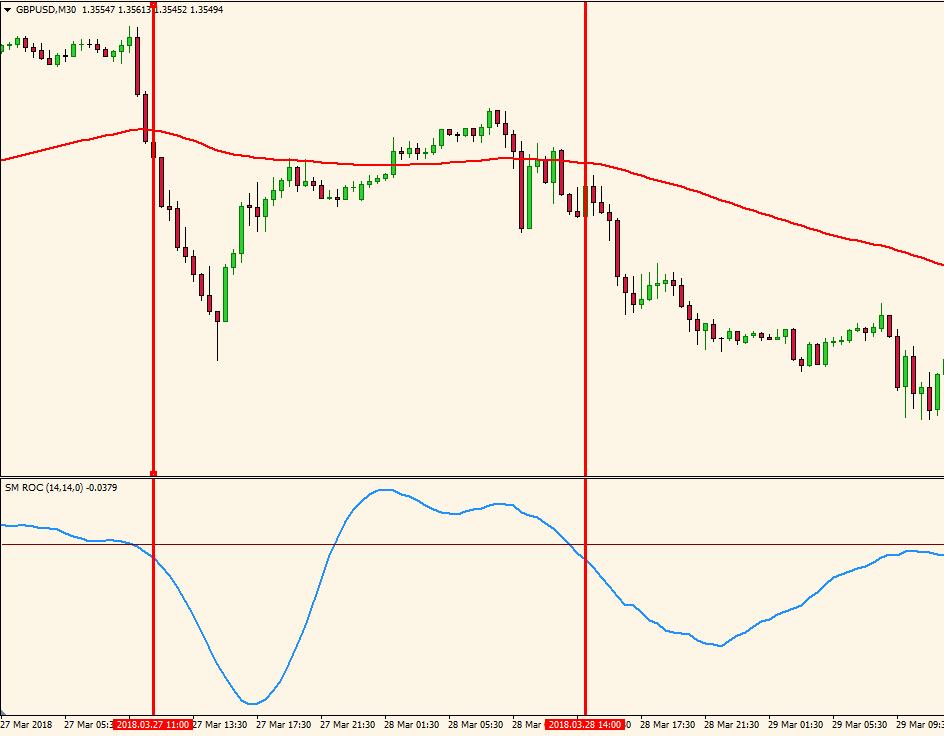
As we can observe in the GBP/USD graph below, when used in combination with a moving average the ROC offers two excellent entries in the market, when the line crosses below the zero-line. As most of the oscillators, the rate of change works well in a trending scenario.
Zero Line Crossover Trading Strategy
- We determine the prevailing trend on the market by plotting a 50-period simple moving average – 50 SMA
- When the price trades above the 50-period simple moving average, we consider taking only long entries. When the price trades below the 50-period simple moving average we consider taking only short entries
- We monitor the rate of change indicator and we take the zero line crossovers only in confirmation with the 50-period moving average.
- We consider exiting the position when the slope of the rate of change turns in the opposite direction.
As we can observe in the chart below, this system generated two valid setups, both short positions. All the conditions were met: the price was traded below the 50-period moving average and the rate of change crossed below the zero line.
Price Rate of Change – Keltner Channel Analysis
Another technical indicator that works well in combination with the rate of change is the Keltner Channel.
Identification of the market trend is one of the most important roles of the Keltner Channel. The indicator is used by traders who want to trade in the direction of the prevailing trend on the market.
In this setup, we determine the current trend by analyzing the Keltner Channel’s slope. The Keltner Channel slope is simply the direction of the channel plotted on the chart.
- An instrument is considered to be in an uptrend when the Keltner Channel’s slope is upward
- An instrument is considered to be in a downtrend when the Keltner Channel’s slope is downward
The rules of the setup are simple: we wait for a breakout of the price outside the Keltner Channel and the move must the confirmed with the Rate of change indicator.
- If the Rate of Change is below the zero level and price closes and stabilizes below the Keltner Channel, we have buying pressure into the market
- If the Rate of Change is above the zero level and price closes and stabilizes above the Keltner Channel, we have selling pressure into the market
For this setup, we will use a Keltner Channel based on a 200-exponential moving average and a 3 multiple of the Average True Range.
Also, the rate of change will have a 100-period input.
We use this high number on the Keltner Channel and the rate of change because we want to smooth the indicators.
Let’s see some charts.
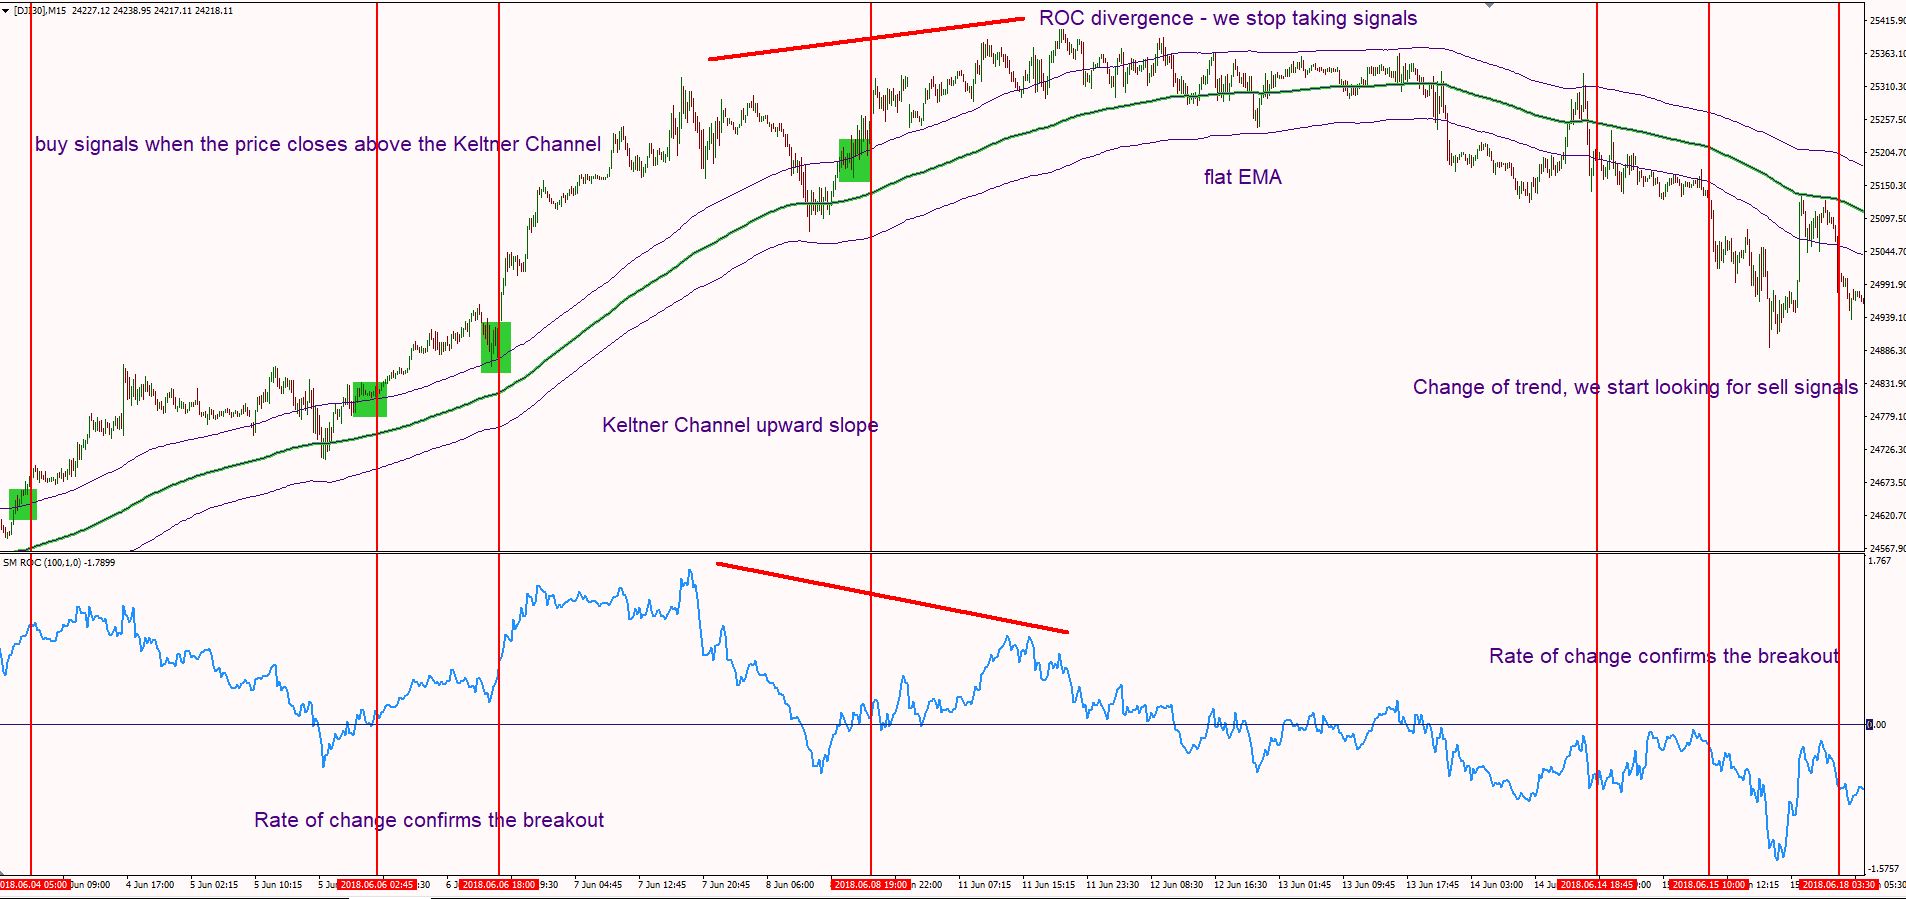
Above we have a Dow Jones Index chart with almost 2 weeks of action.
We added the Keltner Channel with the mentioned settings and we started looking for price breakouts above the channel.
In the left part of the chart, we have a clear uptrend, as the slope of the Keltner Channel points upward.
Once the price closes above the channel, we look at the rate of change, to see if the indicator is above the zero-level.
This setup generated 4 valid signals during the uptrend.
The stop loss placement depends on the style of the trader. You could place a stop loss on the other side of the Keltner Channel. Or you could use the penultimate band as a stop loss.
Also, aim for a 2:1 risk/reward ratio.
During your trading activity you should always pay attention to the slope of the channel. As you can see, once we saw that the slope turned flat, we stopped taking signals.
Also, the Rate of Change gave an early warning, as a classic divergence occurred at the top of the channel.
In the right part of the setup, the trend changed. The slope of the Keltner Channel turned bearish, and the rate of change crossed below the zero-line.
We started looking for sell opportunities once the price closed below the Keltner Channel.
The power of the system is that we have two market forces when trading:
- The main trend indicated by the Keltner Channel
- The market momentum indicated by the rate of change crossing the zero-line
This system is mainly suited for day trading and swing trading, but you could also scalp some decent points with this setup. You just have to adjust the Keltner Channel and the rate of change to be more responsive on the lower time frames.
How To Trade Oversold/Overbought Levels With Price Rate Of Change (ROC)
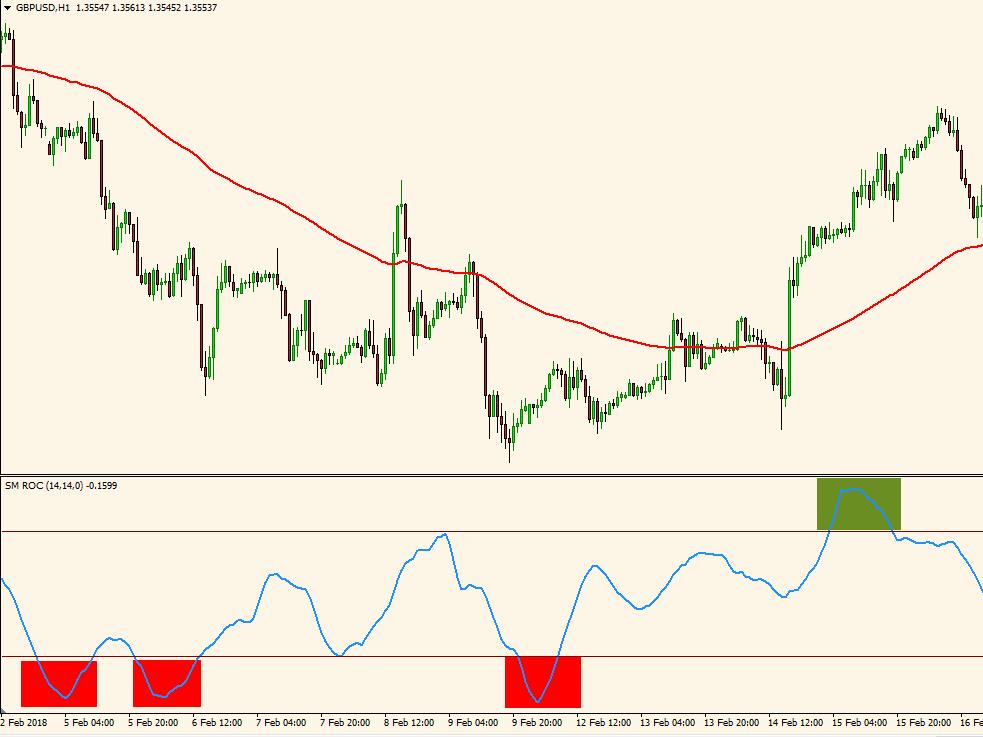
Traders also use the rate of change oscillator for determining overbought and oversold conditions.
- A buy signal occurs when the rate of change moves below a level, into the oversold area, and then crosses back above that level.
- A sell signal occurs when the rate of change moves above a threshold, into the overbought area, and then crosses below that level.
This strategy works well in a non-trending market, during strong trends traders often get false signals, as shown in the picture below.
Rate Of Change Divergence Analysis
The Rate of Change (ROC) oscillator can also detect divergences. A divergence occurs when price action differs from the action of ROC oscillator, meaning that the momentum isn’t reflected in the price, which could be an early indicator of a reversal.
As in the case of Stochastic or RSI oscillators, when a divergence occurs, a potential change in price direction could be on the cards.
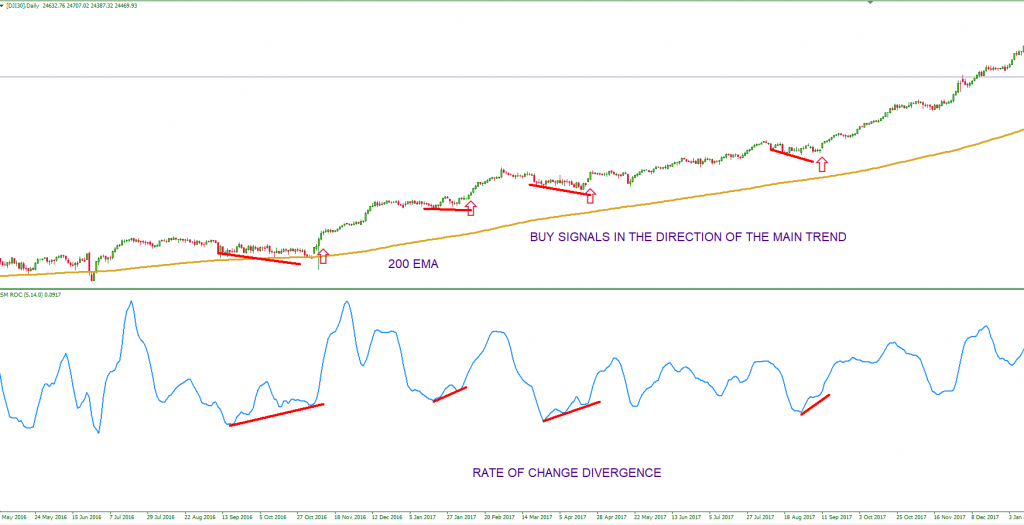
Price Rate of Change Indicator Divergence Trading System
- We determine the main trend by adding a 200-period exponential moving average.
- When the price trades above the 200-period exponential moving average, we consider taking only long entries. When the price trades below the 200-period exponential moving average we consider taking only short entries.
- We plot the rate of change, with a lower input of 5 period – because we are trading on the daily time frame.
- We search for divergences between the rate of change and the price only on the direction of the main trend indicated by the 200-period exponential moving average
- If the price trades above the 200 EMA, we search for divergences on the lower side of the rate of change and if the price trades below the 200 EMA, we search for divergences on the upper side of the rate of change
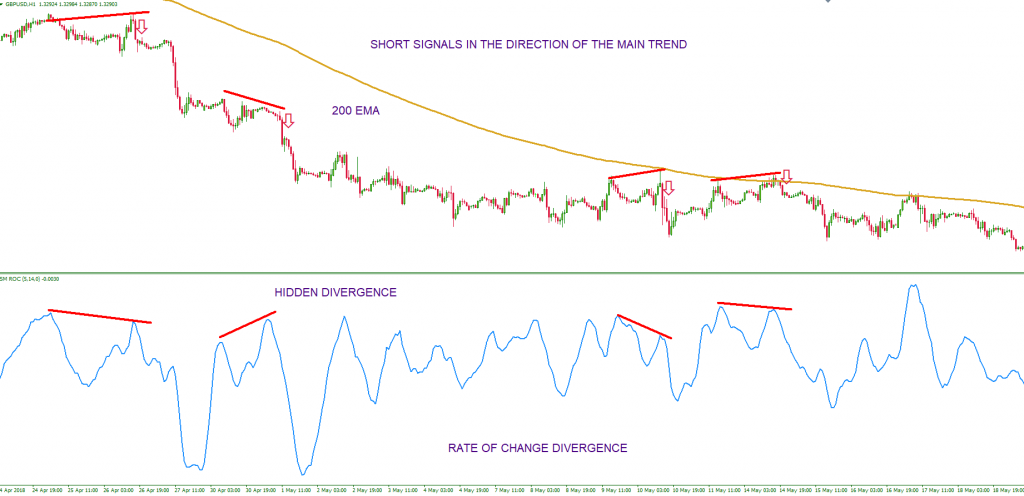
Let’s analyze the GBP/USD chart above. We determined the downtrend with the 200-period exponential moving average. We searched for rate of change divergences on the upper side of the indicator and we only considered short positions. The system generated 4 excellent short signals.
We ignore the signals offered by the divergences on the lower side of the rate of change, as we are in a strong downtrend and chances of whipsaw are considerably higher.
The main advantage of this system is the fact that we have 2 market forces on our side when trading: the long-term trend indicated by the 200 EMA and the momentum offered by the divergence in the rate of change. By using this approach, we’ll reduce the market noise and eliminate false signals.
Rate of Change Indicator Trend Line Breakout Strategy
The rate of change oscillator can also be useful for drawing trend lines. The technique of drawing trend lines is subjective and is largely dependent on the trader’s skill and experience.
This method is no difficult at all: you just have to draw straight lines on the rate of change indicator connecting support points for an uptrend or resistance points for a downtrend.
A valid trend line should connect two or more support points that define the trend.
Once we spot a breakout of the trend line we have 2 choices:
- We could enter the trade based on the breakout
- We could wait for the former rate-of-change trend line to act as a support or resistance
The second method is more conservative, but will also reduce a lot of false signals.
Now, here’s what you should consider. If you will start plotting trend lines on lower time frames, this method it will not be successful. There is too much noise and the risk of getting whipsawed is higher.
That’s why I never use this method on a time frame lower than H1.
Also, in order to increase your chances, you also need to determine the main trend. I prefer to take trend lines breakouts in the direction of the main trend.
I’m not interested in trading breakouts during a secondary trend. I’m not looking to find tops and bottoms.
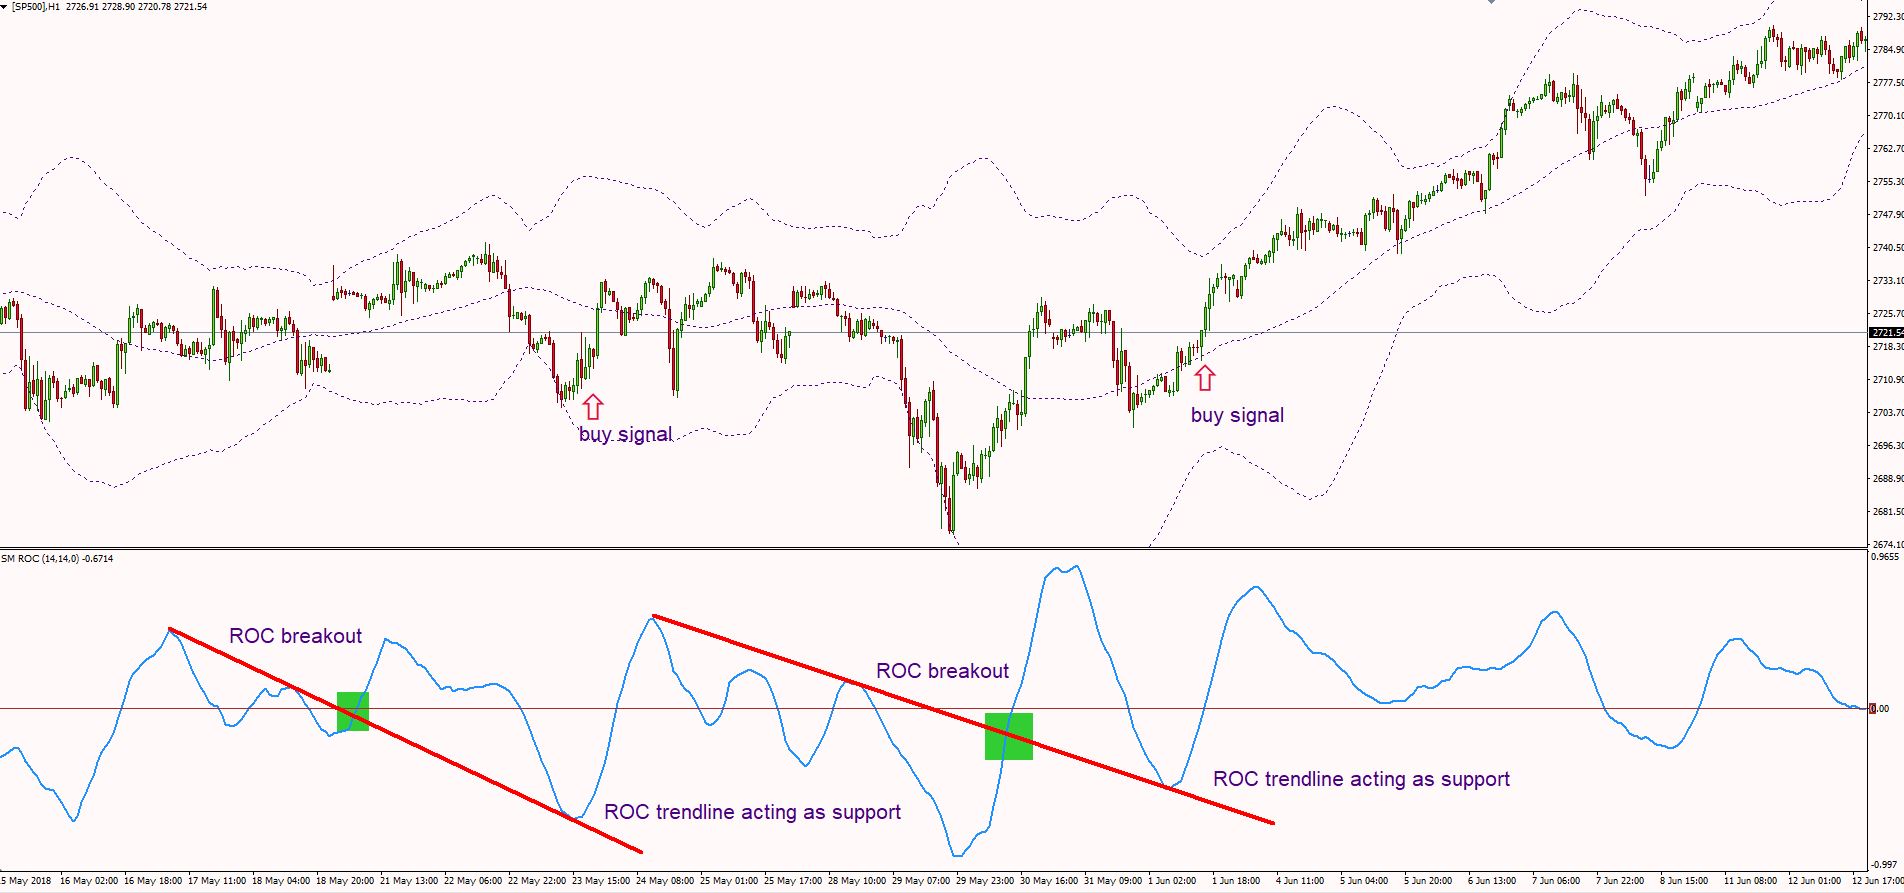
Let’s look at some charts to see this method in action. We plotted the SP500 chart on the H1 timeframe.
For this setup, we used the Bollinger Bands with a 50 moving average and 3.0 standard deviation. Almost 99% of the price action is contained within 3.0 standard deviation of the Bollinger Bands.
So, if a standard deviation of 3.0 will offer me around 99% certainty that the price won’t exit the Bollinger Bands, then I will be interested to trade only with these settings. This indicator will be used just for confirmation.
We ideally want to take the rate of change signals around the lower band or the middle band if we are in an uptrend. Also, during a downtrend, we would want the signal to occur around the upper band or the middle band.
Now, let’s take a look at the rate of change and the trend line breakouts that occurred during this period.
The first signal appeared around the lower band of the Bollinger at the re-test of the rate of change trend line.
We could have entered the market at the breakout of the trend line. However, the safer entry was at the re-test of the trend line.
The second signal was the same pattern. A breakout of the rate of change trend line, and an entry point around the middle band of the Bollinger Bands. You see how the rate of change trend-line which in the past acted as resistance, once broken, became support.
The power of this technique is the fact we are basically trading the support and resistance of the rate of change.
Price Rate of Change (ROC) Indicator – Pros And Cons
- ↑ works well in trending market conditions
- ↑ good at identifying strong momentum, in conjunction with other trending indicators
- ↑ useful at identifying overbought and oversold areas on the chart
- ↑ great at spotting divergences
- ↓ bad at identifying cycle turns, giving a lot of false signals
- ↓ does not contain all of the data necessary for proper analysis of price action, so it should be used in combination with other tools
- ↓ ROC calculation gives equal weight to the most recent price and the price from “n” periods ago, contradicting the fact recent price action should have more importance in determining future price movement.
- ↓ lagging indicator which can produce numerous whipsaws if not used correctly

