Table of Contents
Economic indicators play an important role in the financial markets. Even if you are a technician and don’t use fundamental analysis in your trading style, you must evaluate the potential effect an economic indicator can have on a particular market.
Even if you are trading on Forex market, on the commodities market, on the stock market or on the bond market, you must take economic indicators into account.
Here are the most important 20 indicators, followed by “smart money” on the financial markets.
Gross Domestic Product (GDP)
Gross Domestic Product (GDP) measures the dollar value of all goods and services produced within the United States. The GDP is the most comprehensive measure of the performance of the US economy.
GDP data is presented in nominal and real dollars. Investors are monitoring the real growth rates as they are adjusted to inflation.
Gross Domestic Product (GDP) Interpretation
- A larger-than-expected increase indicates a prospering economy.
- A larger-than-expected decrease indicates a weakening economy. The Federal Reserve might implement an expansionary monetary policy in order to boost the economy.
- A higher GDP growth leads to accelerating inflation. The Federal Reserve might use monetary policy to decrease inflation.
- A healthy Gross Domestic Product increase is between 2.0% and 2.5% (this figure is related to an unemployment rate between 5.5% and 6.0%)
Employment Situation
Employment situation represents a report including the number of payroll jobs at all non-farm business establishments and government agencies.
This report is probably the most closely watched economic indicator because of its accuracy and its importance as an indicator of the U.S. economic activity. That’s why the Employment situation is highly important to investors and it can increase the volatility in the markets.
The analysts see an increase in employment as a sign of a healthy economy. The general outlook is that the greater the increase in employment, the faster the total economic growth.
Employment Situation Interpretation
- A decrease in unemployment rate suggests an expanding economy. This could lead to an increase in interest rates
- An increase in unemployment rate suggests a contracting economy. This could lead to a decrease in interest rates.
- If the average earnings are increasing sharply, this suggests inflationary pressures.
- If the average work-week is increasing, this could lead to additional employment increases.
Consumer Price Index (CPI)
Consumer Price Index (CPI), also known as cost-of-living index, measures the changes in the price of a representative basket of goods and services. The basket of goods and services include food, energy, housing, clothing, transportation, medical care, entertainment and education.
Many analysts monitor the Consumer Price Index excluding food and energy prices, for its monthly stability. This is also known as the “core CPI” and offers a clearer picture of the inflationary trends.
Consumer Price Index Interpretation
- If the core CPI records an increase larger-than-expected, this suggests inflationary pressure
- If the core CPI records a decrease larger-than-expected, this does not automatically suggest deflationary pressure. When CPI drops larger than expected, prices are just re-setting.
Producer Price Index (PPI)
The Producer Price Index (PPI) measures the average price of a fixed basket of capital and consumer goods in the wholesale market.
Analysts prefer to monitor the Producer Price Index by excluding food and energy prices. This is known as the “core PPI” and offers a clearer picture of the underlying inflation trend.
Compared to the consumer price index (CPI) which tracks the price changes from the consumer’s perspective, Producer Price Index measures price changes from the seller’s perspective.
Producer Price Index (PPI) Interpretation
- If the core PPI records larger-than-expected increases, inflationary pressures are generated. The stock market could be negatively affected. Interest rates could increase as a result of a high PPI
- No change or a decline in the core PPI is favorable for bond markets
- A fast increasing PPI should be considered as negative for the USD
Retail Sales
Retail sales is an index measuring the total sales of goods by all retail establishments in the U.S. The sales of services are not included in this index.
Retail sales index is considered by analysts an important indicator of broad consumer spending patterns. Retail sales index is very important to stock investors, being a leading macroeconomic indicator.
Retail sales Interpretation
- If the Retail sales increase, this suggests a healthy This is a good signal for the stock markets
- If the Retail sales decrease over a period of time, this suggests a troubled This translates into a lower inflation, a decrease in stock prices and an increase in bond prices.
Consumer Confidence Index
The Consumer Confidence Index is a survey of 5,000 consumers which measures the attitude of consumers in the current or future performance of the economy. The report basically measures how optimistic or pessimistic are consumers regarding the future economic outlook.
Consumer confidence represents an important indicator of the economy because consumer spending accounts for around two-thirds of gross domestic product (GDP). For this reason, the Consumer Confidence Index is considered a leading economic indicator.
Consumer Confidence Index Interpretation
- If the Consumer Confidence Index increases, consumers spend money, suggesting a healthy economy
- If the Consumer Confidence Index decreases, consumers save money, suggesting a troubled economy
- Only Consumer Confidence Index changes of at least five points should be considered significant.
Industrial Production and Capacity Utilization
Industrial Production report measures the physical output of the country’s factories, mines and gas and electric utilities.
The capacity utilization tracks the proportion of plant and equipment capacity used in production by these industries.
Despite the fact that the industrial sector of the economy accounts for only about 25% of the gross domestic product, changes in the Industrial Production provide investors useful information on the GDP growth.
Industrial Production and Capacity Utilization Interpretation
- Values of over 85% in capacity utilization rate suggest inflationary pressures
- If the Industrial Production records an increase, this suggests a healthy economy
- If the Industrial Production registers a higher-than-expected decrease, this suggests a troubled economy
Existing Home Sales
Existing Home Sales report measures the number of sales of pre-owned houses. This report is considered a decent indicator of activity in the housing sector. Existing Home Sales is considered a leading indicator.
The Existing Home Sales is used by analysts to track the demand in the housing market.
Existing Home Sales Interpretation
- A stable increase in Existing Home Sales report suggests economic growth and an optimistic consumer outlook.
- A decline of Existing Home Sales over a certain period suggests weakening economy. This could lead to interest rates to decrease
- A strong growth of Existing Home Sales should be considered positive for the USD.
- A larger-than-expected decrease in Existing Home Sales should be considered negative for the USD.
ISM Manufacturing Index
The ISM Manufacturing Index is based on surveys of 300 purchasing managers nationwide representing 20 industries regarding manufacturing activity. The indicator tracks the amount of manufacturing activity from the previous month.
The ISM Manufacturing Index covers indicators as new orders, production, employment, inventories, delivery times, prices, export orders, and import orders.
ISM Manufacturing Index Interpretation
- If the ISM Manufacturing Index has a value above 50, this suggests an expanding manufacturing sector and a healthy economy
- If the ISM Manufacturing Index has a value below 50, this suggests a contracting manufacturing sector and economic contraction, especially if the trend continues over several months.
- If the ISM Manufacturing Index is increasing over a period of time, this could suggest bullish stock market due to higher corporate profits. Also, bond markets are prone to decrease.
ISM Services Index (Non-Manufacturing ISM)
ISM Non-Manufacturing Index is a report based on a survey of over 400 purchasing executives in industries including finance, insurance, real-estate, communications and utilities.
The ISM Non-Manufacturing Index tracks employment trends, prices and new orders in non-manufacturing industries. The report offers important information about factors that affect inflation and total output growth.
ISM Services Index (Non-Manufacturing ISM) Interpretation
- Values above 50 indicate expansion for the non-manufacturing components of the economy
- Values below 50 indicate contraction for the non-manufacturing components of the economy
- If the Non-Manufacturing ISM is increasing over a period of time, this could suggest bullish stock market due to higher corporate profits. Also, bond markets are prone to decrease.
Chicago Purchasing Managers’ Index (PMI)
Chicago Purchasing Managers’ Index is a report based on the surveys of over 200 purchasing managers regarding the manufacturing industry in the Chicago area. The report is used to indicate the overall economic condition in the United States.
The Chicago Purchasing Managers’ Index (PMI) includes data on production, new orders, inventories, prices paid, employment, and supplier deliveries.
Chicago Purchasing Managers’ Index Interpretation
- Values above 50 suggest an expanding sector.
- Values below 50 indicate a contracting sector.
- Values above 50 percent should be considered positive for the USD.
- Values below 50 percent should be considered negative for the USD.
Initial Claims
Initial Claims is an index that measures the number of people filing first-time claims for state unemployment benefits.
The Initial Claims report is analyzed by investors because it provides insight into the health of the economy. Investors use this indicator’s four-week moving average to forecast trends in the labor market.
Initial Claims Interpretation
- The lower the values of Initial claims, the stronger the job market
- An increase of over 30,000 in Initial Claims shows a substantial change in job growth, which could represent a warning sign for the economy
- A higher than expected increase in Initial claims should be considered negative for the USD.
- A higher than expected decrease in Initial claims should be considered positive for the USD.
Durable Goods Orders
Durable Goods Orders represents a government index that tracks the dollar volume of orders, shipments and unfilled orders of durable goods. Analysts usually exclude the order from defense and transportation sectors due to their volatility.
Durable goods generally have a normal life expectancy of three years or more. Durable Goods Orders report offers information on the strength of demand for the US manufactured durable goods from domestic and also from foreign sources.
Durable Goods Orders Interpretation
- If the Durable Goods Orders index records an increase, it suggests that demand is strengthening, which will probably lead to increased production and employment.
- If the Durable Goods Orders index records a decrease larger-than-expected, it suggests that demand is weakening, which might translate into a decrease of production and employment.
Beige Book
Beige Book is a report published by the United States Federal Reserve Board which offers a picture of the economic trends and challenges in the United States. The Beige Book summarizes this information by District and sector.
The Beige Book is used by the Federal Open Market Committee (FOMC) in their decision on short-term interest rates.
Beige Book Interpretation
- If the Beige Book report presents inflationary pressures, the Federal Reserve may opt to increase interest rates
- If the Beige Book report presents recessionary conditions, the Federal Reserve may opt to decrease interest rates.
- An optimistic picture should be considered as positive for the USD.
- A pessimistic picture should be considered as negative for the USD.
Employment Cost Index (ECI)
The Employment Cost Index (ECI) is a report measuring changes in the cost of labor, including wages and salaries, as well as benefits.
Analysts use the Employment Cost Index in order to track the health of the economy. The index is also useful in evaluating wage trends and the risk of wage inflation.
Employment Cost Index (ECI) Interpretation
- If the Employment Cost Index registers steady increases, this suggests a healthy economy
- If the Employment Cost Index registers a larger-than-expected decrease, this suggests a troubled economy
- If the Employment Cost Index records a greater-than-expected increase over a period of time, this suggests this suggest inflationary pressure. As a result, interest rates will increase, while bond and stock prices will decrease.
Housing Starts and Building Permits
Housing Starts and Building Permits measures the number of residential units on which construction is begun each month.
This indicator is used by analysts to predict the changes in the gross domestic product (GDP).
Housing Starts and Building Permits Interpretation
- A stable increase in Housing Starts and Building Permits suggests economic growth and an optimistic consumer outlook.
- A decline of Existing Home Sales over a certain period suggests a contraction of the economy.
- An increase in Housing Starts and Building Permits can also be a sign of job growth in the construction industry
Trade Balance Report
Trade Balance Report measures the difference between exports and imports of U.S. goods and services.
The trade balance is analyzed by investors in order to measure the strength of the country’s economy in relation to other countries.
Trade Balance Report Interpretation
- Stronger exports are bullish for the stock market
- Changes in the trade balance report with particular countries can have implications for the foreign exchange and the policy with that trading partner
Personal Income
Personal Income represents a report including the income that households receive from all sources, including employment, self-employment, transfer payments and investments.
Personal income has a large effect on consumer consumption.
Personal Income Interpretation
- Higher values of Personal income over a period of time translates into greater spending, a healthy economy. High Personal Income also benefits the stock market
- A decrease in Personal income over a period of time suggests a contraction in the economy and affects negatively the stock market
Philadelphia Fed
Philadelphia Fed is a regional manufacturing index which covers Pennsylvania, New Jersey and Delaware. This region represents a reasonable cross-section of national manufacturing activities.
Philadelphia Fed offers an early indication of price direction, employment levels, and general business conditions.
Philadelphia Fed Interpretation
- Values above 0 of the Philadelphia Fed index suggest an expanding factory sector
- Values below 0 of the Philadelphia Fed index suggest a contracting factory sector
New Home Sales
New Home Sales measures the number of newly constructed homes with a committed sale during the month.
Because the report is released at the end of each month, investors prefer the existing home sales report, which accounts for around 84% of all houses sold and is released earlier in the month.
New Home Sales Interpretation
- A stable increase in New Home Sales report suggests economic growth and an optimistic consumer outlook.
- A decline of New Home Sales over a certain period suggests a contraction of the economy
Economic Calendar
Now that you know what are the indicators followed by “smart money”, you might ask yourselves where do you get those numbers.
It’s simple, you just have to consult an economic calendar. An economic calendar covers financial events and indicators from all over the world and it’s automatically updated when new data is released.
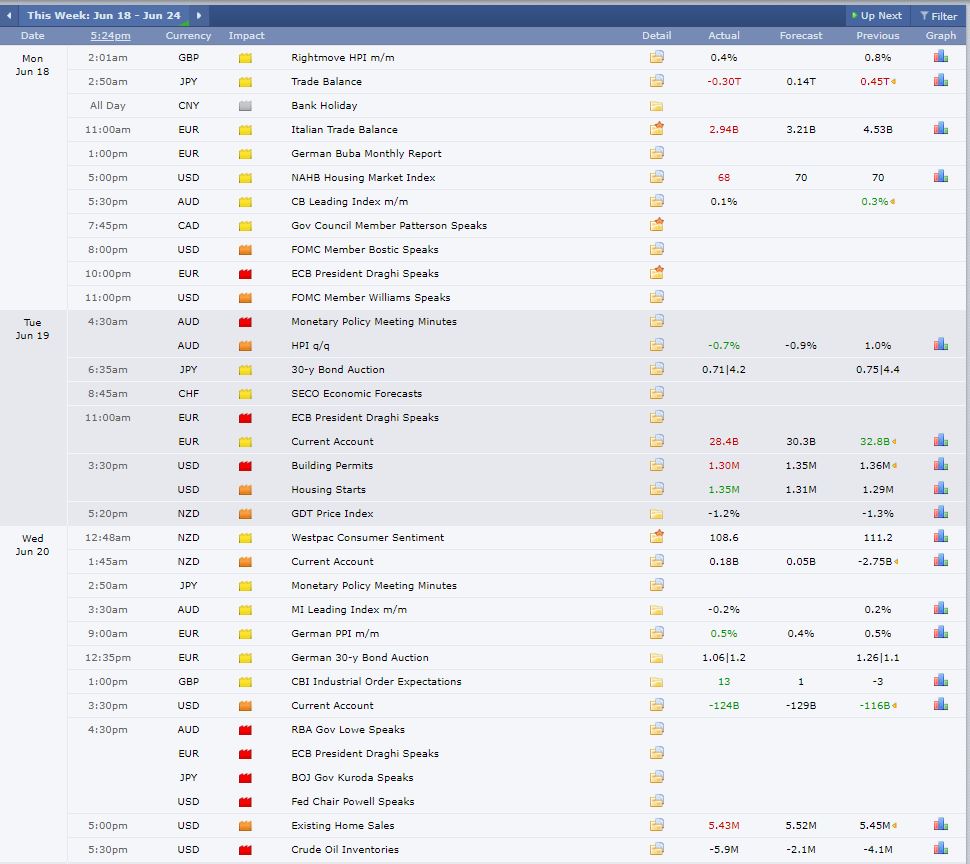
An economic calendar is a very important tool for any trader, especially if their strategies are based on smaller time frames.
If you are not consulting an economic calendar when start trading you will often witness the market moving against you very sharply and seemingly without reason, without knowing why.
Well, these fast movements are due to news or economic indicators being released.
I prefer to use the economic calendar on the Forex Factory website. Here is my routine:
- At the start of each trading day, I check the calendar for the most important releases of economic indicators.
- If during that day, a major economic indicator will be released (Non-Farm Payrolls, GDP, CCI, PPI etc.) I might trade the news or scalp a few points from the market.
- If I have a trade previously opened, I monitor it closely and analyze the figures of the released economic indicator in order to see if the fundamental news are in line with my technical analysis.
Final Thoughts
As financial markets developed, in order to obtain a fair market image, it is advisable to take a look at the key economic indicators.
An informed trader takes into account all the factors that might help him to get a better picture of the market he is trading.
So, before entering a trade, you should consult an economic calendar and evaluate the potential effects of the economic indicators on your portfolio.